Node Monitoring
n2x.io offers hassle-free, out-of-the-box monitoring for your nodes.
n2x.io provides a self-developed system that monitors and analyzes various aspects of your computer systems and networks. It delivers real-time and historical data about their performance, usage, and health, allowing administrators or users to make informed decisions and troubleshoot issues.
Resource Monitoring
n2x.io monitors resource utilization of your nodes, including CPU usage, memory utilization, disk I/O, and network bandwidth usage, to identify resource bottlenecks or performance issues.
The current metrics available are:
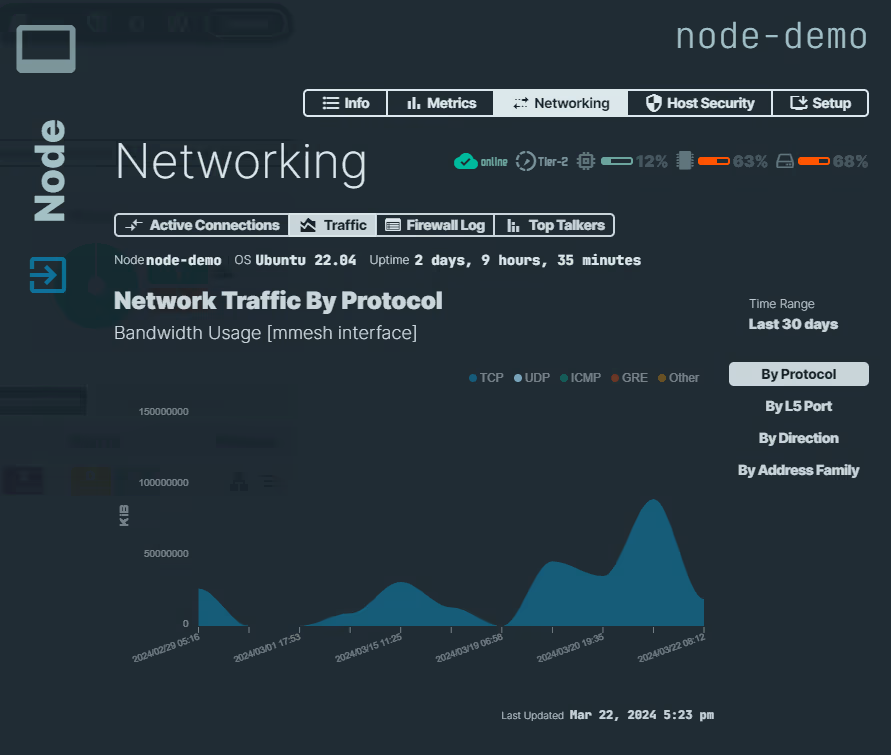
- Network Traffic: bandwidth usage (on the n2x interface, in KiB).
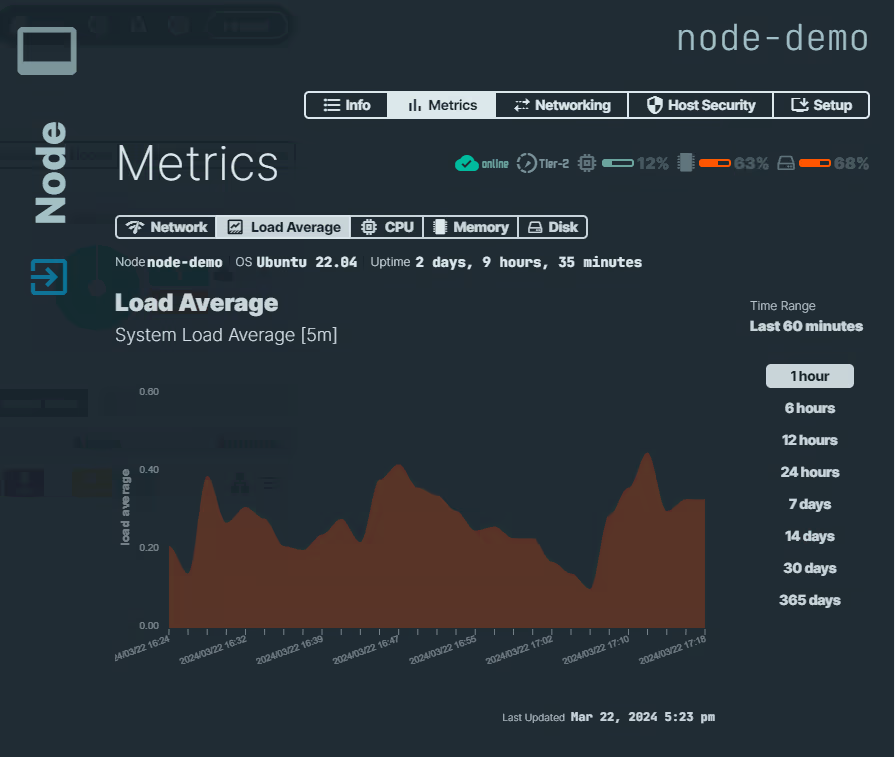
- Load Average: System load average (5 minutes)
- CPU Usage: Core utilization (%)
- Memory Usage: RAM utilization (%)
- Disk Usage: Main disk partition utilization (%)
To access your node metrics:
-
In the left-hand navigation menu, click
Network TopologyorNodes. -
Select the node by clicking on it.
-
Select the
Metricsection in the menu. -
You can view different metrics by clicking on the
Network,Load Average,CPU,Memory, andDiskoptions. Additionally, you can switch between different time periods (e.g., 1 hour, 24 hours, 7 days).
Network Traffic Analysis
n2x.io analyzes network traffic on the n2x interface of your nodes to identify patterns, anomalies, and potential security threats.
The current metrics available are:
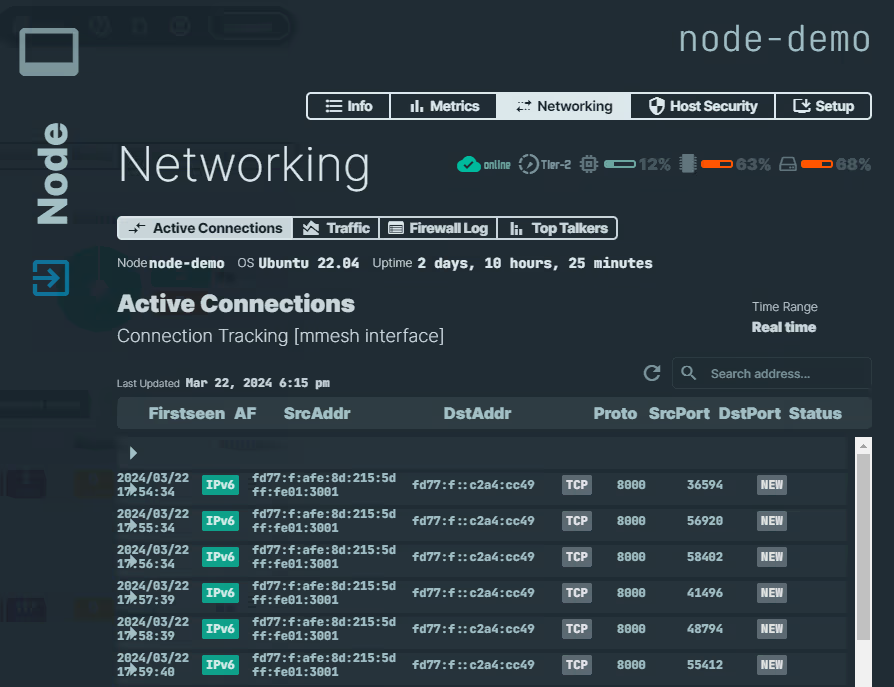
- Active Connections: Offers connection tracking functionality, allowing you to view a list of currently active connections on the n2x interface.
- Traffic: Network bandwidth usage by protocol type.
- Firewall Log: Connections blocked by the distributed firewall as a service (FWaaS).
- Top Talkers: Top sources and destinations consuming the most bandwidth.
To access your node metrics:
-
In the left-hand navigation menu, click
Network TopologyorNodes. -
Select the node by clicking on it.
-
Select the
Networkingsection in the menu. -
You can view different metrics by clicking on the
Active Connections,Traffic,Firewall Log, andTop Talkersoptions.
