Distributed Tracing in Kubernetes: OpenTelemetry and Grafana Tempo for end-to-end visibility
Distributed tracing is a diagnostic technique used to track requests as they traverse throughout the microservices architecture.
What benefit can it bring us?
- Faster Debugging: Say goodbye to endless log diving! Trace an error back to its root cause, pinpointing the exact service and line of code causing the issue.
- Performance Optimization: Identify bottlenecks and slowdowns with laser precision. Uncover which service is lagging and optimize its performance for a smoother user experience.
- Enhanced Security: Monitor service access patterns and identify potential vulnerabilities before they become threats.
- Microservices Mastery: Understand how your services interact, identify dependencies, and optimize communication patterns for a well-orchestrated microservices ecosystem.
In the microservices architectures, especially those orchestrated with Kubernetes, configuring distributed tracing becomes an essential tool to understand the behavior of our application and enhance decision-making based on gaining insights into your application's performance.
At this point, emerge a duo related to observability that can help developers and operators with distributed tracing of your applications: OpenTelemetry and Grafana Tempo.
This tutorial guides you through setting up end-to-end distributed tracing in Kubernetes using Grafana Tempo as the backend and a Demo Flask application instrumented with OpenTelemetry. We will deploy a Grafana and Grafana Tempo in a self-hosted Kubernetes cluster, and an OpenTelemetry Collector and Demo Flask application in an Amazon EKS cluster. Finally, we will create a network topology using n2x.io that allows communications between Grafana Tempo and OpenTelemetry Collector securely.
Here is the high-level overview of tutorial setup architecture:
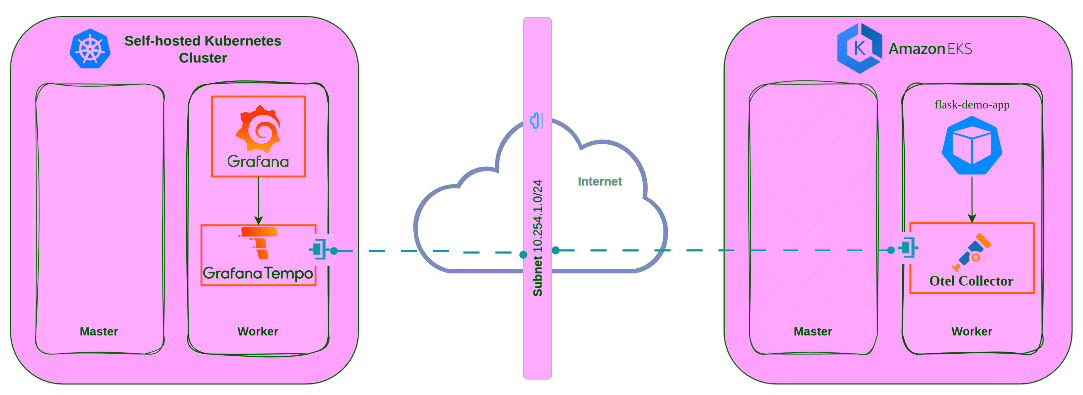
In our setup, we will be using the following components:
- OpenTelemetry is a vendor-neutral open source Observability framework for instrumenting, generating, collecting, and exporting telemetry data such as traces, metrics, and logs. For more info please visit the OpenTelemetry Documentation
- Grafana is an analytics and interactive visualization platform. For more info please visit the Grafana Documentation
- Grafana Tempo is an open-source, easy-to-use, and high-volume distributed tracing backend. For more info please visit Grafana Tempo Documentation.
- n2x-node is an open-source agent that runs on the machines you want to connect to your n2x.io network topology. For more info please visit n2x.io Documentation.
Before you begin
To complete this tutorial, you must meet the following requirements:
- Access two Kubernetes clusters (Self-hosted and EKS), version
v1.27.xor greater. - A n2x.io account created and one subnet with
10.254.1.0/24prefix. - Installed n2xctl command-line tool, version
v0.0.3or greater. - Installed kubectl command-line tool, version
v1.27.xor greater. - Installed helm command-line tool, version
v3.10.1or greater.
Note
Please note that this tutorial uses a Linux OS with an Ubuntu 22.04 (Jammy Jellyfish) with amd64 architecture.
Step-by-step Guide
Step 1: Installing Grafana Tempo in a self-hosted Kubernetes cluster
Once you have successfully set up your Self-Hosted Kubernetes cluster, setting your context:
kubectl config use-context <self_hosted_cluster>
Grafana Tempo is the tracing backend we will be using in this tutorial. We are going to install and configure Grafana Tempo in single binary mode on a Kubernetes private cluster using Helm:
-
Add Grafana’s chart repository to Helm:
helm repo add grafana https://grafana.github.io/helm-charts -
Update the chart repository:
helm repo update -
Create a file called
tempo-values.yamland add the following configuration settings:replicas: 1 tempo: storage: trace: backend: local local: path: /var/tempo/traces wal: path: /var/tempo/walInfo
In this tutorial, we are going to use local storage but object storage (Amazon S3, GCS, Azure Blob Storage) is recommended for production workloads.
-
Install the
1.10.3version of Grafana Tempo with the defined configuration:helm install grafana-tempo grafana/tempo -f tempo-values.yaml -n grafana-tempo --create-namespace --version 1.10.3Once Grafana Tempo is installed, you should see the following output:
NAME: grafana-tempo LAST DEPLOYED: Mon Aug 19 17:17:45 2024 NAMESPACE: grafana-tempo STATUS: deployed REVISION: 1 TEST SUITE: None -
Now, you can verify if Grafana Tempo is up and running:
kubectl -n grafana-tempo get podNAME READY STATUS RESTARTS AGE grafana-tempo-0 1/1 Running 0 75sWe can confirm that the service was deployed successfully with the following command:
kubectl -n grafana-tempo get serviceNAME TYPE CLUSTER-IP EXTERNAL-IP PORT(S) AGE grafana-tempo ClusterIP 10.96.142.52 <none> 3100/TCP,6831/UDP,6832/UDP,14268/TCP,14250/TCP,9411/TCP,55680/TCP,55681/TCP,4317/TCP,4318/TCP,55678/TCP 2m34sNote
The Grafana Tempo service has a several of ports exposed, but in this tutorial we will focus on couple ports designated for OpenTelemetry Collector :
4317/TCP(gRPC receiver) and4318/TCP(HTTP receiver).
Step 2: Connecting Grafana Tempo to our n2x.io network topology
Grafana Tempo needs to be accessible by OpenTelemetry Collector to be able to send the traces.
To connect a new kubernetes service to the n2x.io subnet, you can execute the following command:
n2xctl k8s svc connect
The command will typically prompt you to select the Tenant, Network, and Subnet from your available n2x.io topology options. Then, you can choose the service you want to connect by selecting it with the space key and pressing enter. In this case, we will select grafana-tempo: grafana-tempo.
Note
The first time that you connect a k8s svc to the subnet, you need to deploy a n2x.io Kubernetes Gateway.

Finding IP address assigned to the Grafana Tempo Service:
-
Access the n2x.io WebUI and log in.
-
In the left menu, click on the
Network Topologysection and choose thesubnetassociated with your Grafana Tempo Service (e.g., subnet-10-254-0). -
Click on the
IPAMsection. Here, you'll see both IPv4 and IPv6 addresses assigned to thegrafana-tempo.grafana-tempo.n2x.localendpoint. Identify the IP address you need for your specific use case.
Info
Remember the IP address assigned to
grafana-tempo.grafana-tempo.n2x.localendpoint, we must be used it as OTPL Endpoint in OpenTelemetry Collector configuration later.
Step 3: Installing and Configuring OpenTelemetry Collector in EKS Cluster
Once you have successfully set up your EKS cluster, setting your context:
kubectl config use-context <eks_cluster>
OpenTelemetry Collector allows us to receive telemetry data from flask-web-app and export this data to Grafana Tempo. We are going to install and configure OpenTelemetry Collector in an EKS Cluster using a pre-made Helm chart provided by OpenTelemetry:
-
Add OpenTelemetry’s chart repository to Helm:
helm repo add open-telemetry https://open-telemetry.github.io/opentelemetry-helm-charts -
Update the chart repository:
helm repo update -
The OpenTelemetry Collector needs to be configured to forward traces to Grafana Tempo. Create a file called
collector-values.yamland add the following configuration settings:mode: "deployment" replicaCount: 1 image: repository: "otel/opentelemetry-collector-k8s" config: receivers: otlp: # the OTLP receiver the app traces protocols: grpc: endpoint: 0.0.0.0:4317 http: endpoint: 0.0.0.0:4318 processors: batch: {} exporters: otlp: endpoint: 10.254.1.200:4317 tls: insecure: true service: pipelines: traces/dev: receivers: [otlp] processors: [batch] exporters: [otlp] resources: limits: cpu: 200m memory: 512MiWarning
Update the
exporters.otlp.endpointvalue with the n2x.io IP address assigned to Grafana Tempo in the previous step (e.g.,10.254.1.200)." -
Deploy OpenTelemetry Collector with the defined configuration:
helm install opentelemetry-collector open-telemetry/opentelemetry-collector -f collector-values.yaml --version 0.102.1Once OpenTelemetry Collector is installed, you should see the following output:
NAME: opentelemetry-collector LAST DEPLOYED: Mon Aug 19 17:50:40 2024 NAMESPACE: default STATUS: deployed REVISION: 1 TEST SUITE: None NOTES: -
Now, we can verify if OpenTelemetry Collector is up and running:
kubectl get podNAME READY STATUS RESTARTS AGE opentelemetry-collector-d6856b5df-b2b6p 1/1 Running 0 111s
Step 4: Connecting OpenTelemetry Collector to our n2x.io network topology
OpenTelemetry Collector needs to have connectivity with Grafana Tempo to export the traces. Therefore, we are going to connect the OpenTelemetry Collector to our n2x.io network topology.
To connect a new kubernetes workload to the n2x.io subnet, you can execute the following command:
n2xctl k8s workload connect
The command will typically prompt you to select the Tenant, Network, and Subnet from your available n2x.io topology options. Then, you can choose the workload you want to connect by selecting it with the space key and pressing enter. In this case, we will select default: opentelemetry-collector.

Now we can access the n2x.io WebUI to verify that the opentelemetry-collector workload is correctly connected to the subnet:

Step 5: Deploying the Demo Flask Application in the EKS Cluster
Now that we have Grafana Tempo and OpenTelemetry Collector set up, it’s time to deploy our Demo Flask application in the EKS Cluster.
In this section, we will deploy a Demo Flask application, which returns the IP address, hostname, and the number of requests received by the application. This Demo Flask application is already instrumented with OpenTelemetry, and configured to send trace data to the OpenTelemetry collector instance in our Kubernetes cluster over gRPC using OTLP (OpenTelemetry Protocol).
Info
Demo Flask application was created as container and pushed to DockerHub repository.
Tip
If you want know how to instrument your Python application with OpenTelemetry, take a look at Manual instrumentation for OpenTelemetry Python
The following YAML file contains k8s deployment manifest of flask-demo-app:
apiVersion: apps/v1
kind: Deployment
metadata:
  name: flask-demo-deploy
spec:
  replicas: 1
  selector:
    matchLabels:
      app: flask-demo-app
  template:
    metadata:
      labels:
        app: flask-demo-app
    spec:
      containers:
      - name: flask-demo
        image: jsantisteban/flask-demo-otel:latest
        ports:
        - containerPort: 8000
        env:
        - name: OTEL_COLLECTOR_EP
          value: http://opentelemetry-collector:4317
---
apiVersion: v1
kind: Service
metadata:
  name: flask-demo-svc
spec:
  selector:
    app: flask-demo-app
  ports:
  - name: http
    port: 8000
    targetPort: 8000
  type: ClusterIP
We can save this file as flask-demo-app.yaml and run the following command to deploy the application in the cluster:
kubectl apply -f flask-demo-app.yaml
Check if the pod is up and running state:
kubectl get pod
NAME                                       READY   STATUS    RESTARTS   AGE
flask-demo-deploy-6dbcc6b858-7txgm         1/1     Running   0          17s
opentelemetry-collector-68557f6648-92gsl   2/2     Running   0          6m30s
We can confirm that the service was deployed successfully with the following command:
kubectl get service
NAME                      TYPE        CLUSTER-IP      EXTERNAL-IP   PORT(S)                                                   AGE
flask-demo-svc            ClusterIP   10.96.137.56    <none>        8000/TCP                                                  34s
kubernetes                ClusterIP   10.96.0.1       <none>        443/TCP                                                   21m
opentelemetry-collector   ClusterIP   10.96.111.243   <none>        6831/UDP,14250/TCP,14268/TCP,4317/TCP,4318/TCP,9411/TCP   13m
At this point, we have successfully deployed our Demo Flask application. Now we need to interact with the application through the web browser so that some traces can be sent to the OpenTelemetry collector and then to Grafana tempo.
Execute the following command to port-forward the service of the Demo Flask application to your local environment:
kubectl port-forward svc/flask-demo-svc 8000:8000
Then you can access the application from your web browser by entering the following URL: http://localhost:8000/

Step 6: Installing and Configuring Grafana in a self-hosted Kubernetes cluster
Up until now, we have successfully deployed our Demo Flask application and have been able to interact with it. Now, it's time to visualize the traces stored in Grafana Tempo with Grafana.
The first step is switch to a Self-Hosted Kubernetes cluster context:
kubectl config use-context <self_hosted_cluster>
Now, we are going to install Grafana on a Kubernetes self-hosted Kubernetes cluster using Helm:
-
Install Grafana version
8.4.5with default configuration in thegrafananamespace:helm install grafana grafana/grafana -n grafana --create-namespace --version 8.4.5Once Grafana is installed, you should see the following output:
2. Now, we can verify if Grafana is up and running:NAME: grafana LAST DEPLOYED: Mon Aug 19 18:11:15 2024 NAMESPACE: grafana STATUS: deployed REVISION: 1 NOTES: ...kubectl -n grafana get podNAME READY STATUS RESTARTS AGE grafana-64966db5bf-fzf6j 1/1 Running 0 3m5sWe can confirm that the service was deployed successfully with the following command:
kubectl -n grafana get service3. We can get the GrafanaNAME TYPE CLUSTER-IP EXTERNAL-IP PORT(S) AGE grafana ClusterIP 10.96.73.198 <none> 80/TCP 3m5sadminuser password by running:kubectl get secret --namespace grafana grafana -o jsonpath="{.data.admin-password}" | base64 --decode ; echo
Once retrieved, it is time we set up our Grafana. We can port-forward the Grafana service and access the Grafana dashboard directly from http://localhost:8080/:
kubectl -n grafana port-forward svc/grafana 8080:80
Info
You can login with admin user and password getting before.
Step 7: Viewing Traces in Grafana
Now that Grafana is up and running, it's time to explore the traces collected from our Demo Flask application. But before that, we need to add Grafana Tempo as a data source (Home > Connections > Data Sources > Add data source):


Info
As the Connection URL, use the endpoint of the Grafana Tempo service: http://grafana-tempo.grafana-tempo.svc.cluster.local:3100
Click Save & Test to make sure Grafana can connect with Grafana Tempo. You should see this pop-up if the connection was successful:

At this point, we can now make queries to Tempo data source we just added. So we will click on Explore button, select Search option in Query type field and click on Run query. You should see the traces:


If you click on any Trace ID, you can see detailed trace information, such as the name or duration of each span:

We're done!
We already have the end-to-end distributed tracing environment with OpenTelemetry ready.
Conclusion
OpenTelemetry and Grafana Tempo provide a comprehensive solution for distributed tracing, enabling you to gain deep insights into the behavior and performance of your applications. They empower you to identify and resolve issues, optimize performance, and achieve end-to-end observability across your entire system.
In this tutorial, we've learned how to set up end-to-end distributed tracing in Kubernetes using Grafana Tempo as the backend, Grafana for visualization, and Demo Flask application instrumented with OpenTelemetry. Also, we have used n2x.io to create a unified tracing solution for multi-cloud or multi-site environments. This unified solution can help the operation teams of your organization to debug and troubleshoot faster avoiding the problems caused by data silos.
We recommend you read the article Observability Tools as Data Silos of Troubleshooting if this topic was interesting to you.