Gathering Metrics with Grafana Alloy and Mimir across Multiple Sites
In this guide, we will learn how to deploy a centralized observability architecture using n2x.io, Grafana Mimir, and Grafana Alloy. This architecture collects metrics from a physical server and two Kubernetes clusters (one private and one cloud-based) using Grafana Alloy, sending all data to a single Mimir backend.
Here is the high-level overview of our setup architecture:
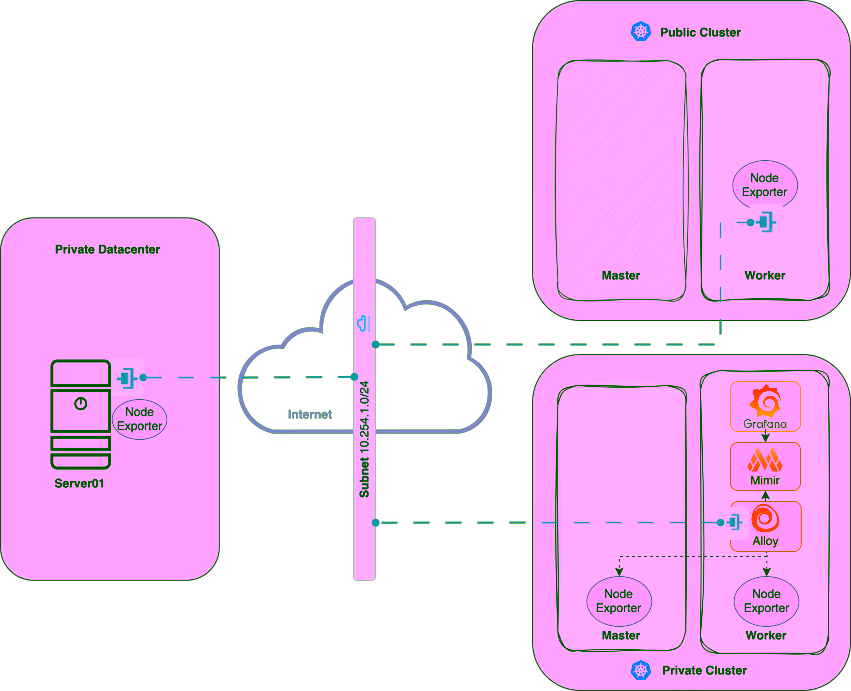
In our setup, we will be using the following components:
- Grafana is an analytics and interactive visualization platform. For more info please visit the Grafana Documentation
- Grafana Mimir is an open-source, horizontally scalable, highly available, multi-tenant time series database designed for long-term storage of Prometheus and OpenTelemetry metrics. It enables users to ingest metrics, run queries, set up recording and alerting rules, and manage data across multiple tenants. For more information, please visit the Grafana Mimir Documentation.
- Grafana Alloy is an open-source, vendor-neutral distribution of the OpenTelemetry Collector. It enables the collection, processing, and export of telemetry data—including metrics, logs, traces, and profiles—through programmable pipelines. Alloy supports both push and pull data collection methods and integrates seamlessly with backends like Grafana Mimir, Loki, and Tempo. For more information, please visit the Grafana Alloy Documentation.
- n2x-node is an open-source agent that runs on the machines you want to connect to your n2x.io network topology. For more info please visit n2x.io Documentation.
Before you begin
In order to complete this tutorial, you must meet the following requirements:
- Access to at least two Kubernetes clusters, version
v1.34.xor greater. - A n2x.io account created and one subnet with
10.254.1.0/24prefix. - Installed n2xctl command-line tool, version
v0.0.4or greater. - Installed kubectl command-line tool, version
v1.34.xor greater. - Installed helm command-line tool, version
v3.17.3or greater.
Note
Please note that this tutorial uses a Linux OS with an Ubuntu 24.04 (Noble Numbat) with amd64 architecture.
Step-by-step Guide
Step 1: Install Grafana Mimir on a private cluster
Setting your context to Kubernetes Private cluster:
kubectl config use-context k8s-private
We are going to deploy a Grafana Mimir on a k8s-private cluster using the official Helm chart:
-
First, let’s add the following Helm repo:
helm repo add grafana https://grafana.github.io/helm-charts -
Update all the repositories to ensure helm is aware of the latest versions:
helm repo update -
Go ahead and deploy Grafana Mimir into your Kubernetes cluster by executing the following command:
helm install mimir grafana/mimir-distributed -n monitoring --create-namespace --version 6.0.3 --wait --timeout 400s -
Run the following command to check the Grafana Mimir Pod is in Running state:
kubectl -n monitoring get podsNAME READY STATUS RESTARTS AGE mimir-alertmanager-0 1/1 Running 0 2m46s mimir-compactor-0 1/1 Running 0 2m46s mimir-distributor-64798c7cff-x48cq 1/1 Running 0 2m46s mimir-gateway-796b4794b5-ptj9q 1/1 Running 0 2m46s mimir-ingester-zone-a-0 1/1 Running 0 2m46s mimir-ingester-zone-b-0 1/1 Running 0 2m46s mimir-ingester-zone-c-0 1/1 Running 0 2m46s mimir-kafka-0 1/1 Running 0 2m46s mimir-make-minio-buckets-5.4.0-2sc9t 0/1 Completed 0 2m46s mimir-minio-67b56f6cc9-vpmmx 1/1 Running 0 2m46s mimir-overrides-exporter-677f46569-4kdxh 1/1 Running 0 2m46s mimir-querier-8bf9999fd-vmbpp 1/1 Running 0 2m46s mimir-querier-8bf9999fd-z2x88 1/1 Running 0 2m46s mimir-query-frontend-f94fd5b87-5k9d9 1/1 Running 0 2m46s mimir-query-scheduler-868df8b8db-88dn7 1/1 Running 0 2m46s mimir-query-scheduler-868df8b8db-9ztsr 1/1 Running 0 2m46s mimir-rollout-operator-7ccfb898b-l6rd4 1/1 Running 0 2m46s mimir-ruler-6d6b8ff687-l6f78 1/1 Running 0 2m46s mimir-store-gateway-zone-a-0 1/1 Running 0 2m46s mimir-store-gateway-zone-b-0 1/1 Running 0 2m46s mimir-store-gateway-zone-c-0 1/1 Running 0 2m46s
Step 2: Connect Grafana Mimir to our n2x.io network topology
Grafana Mimir needs to have connectivity with Grafana Alloy agents so that they can push metrics.
To connect a new kubernetes service to the n2x.io subnet, you can execute the following command:
n2xctl k8s svc connect
The command will typically prompt you to select the Tenant, Network, and Subnet from your available n2x.io topology options. Then, you can choose the service you want to connect by selecting it with the space key and pressing enter. In this case, we will select monitoring: mimir-gateway.
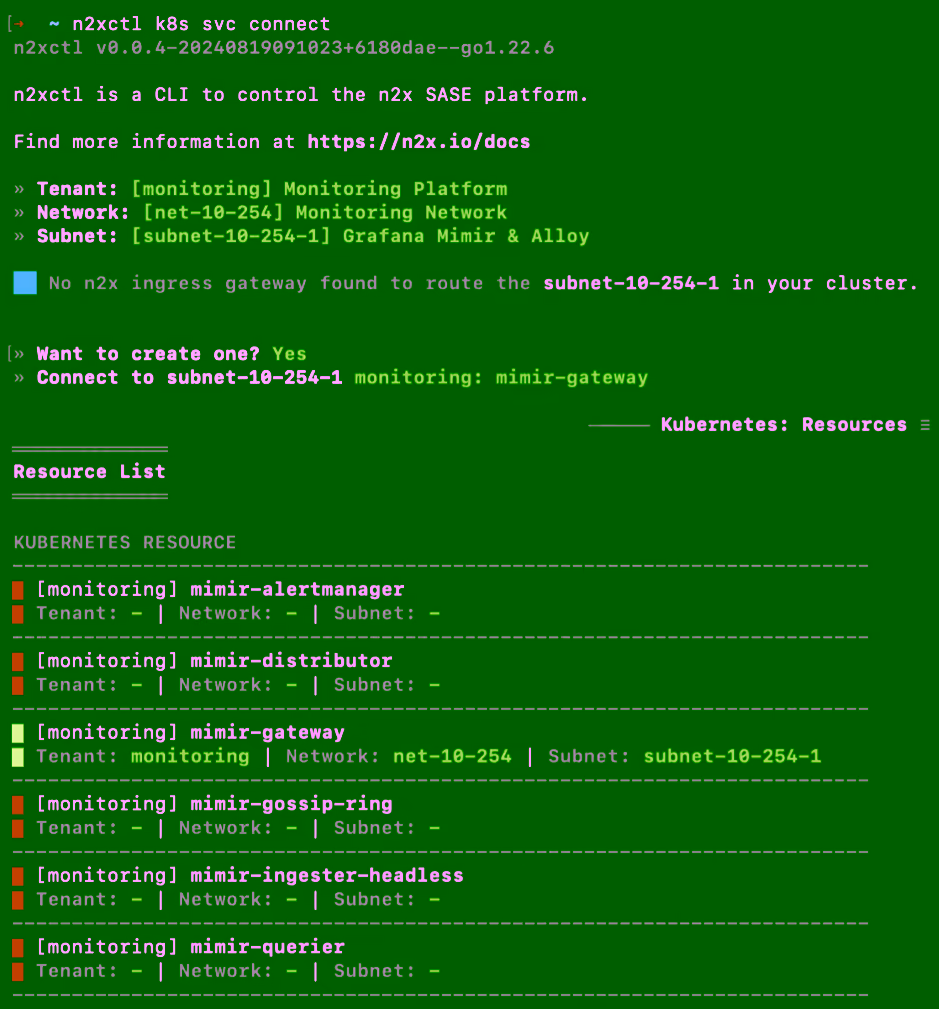
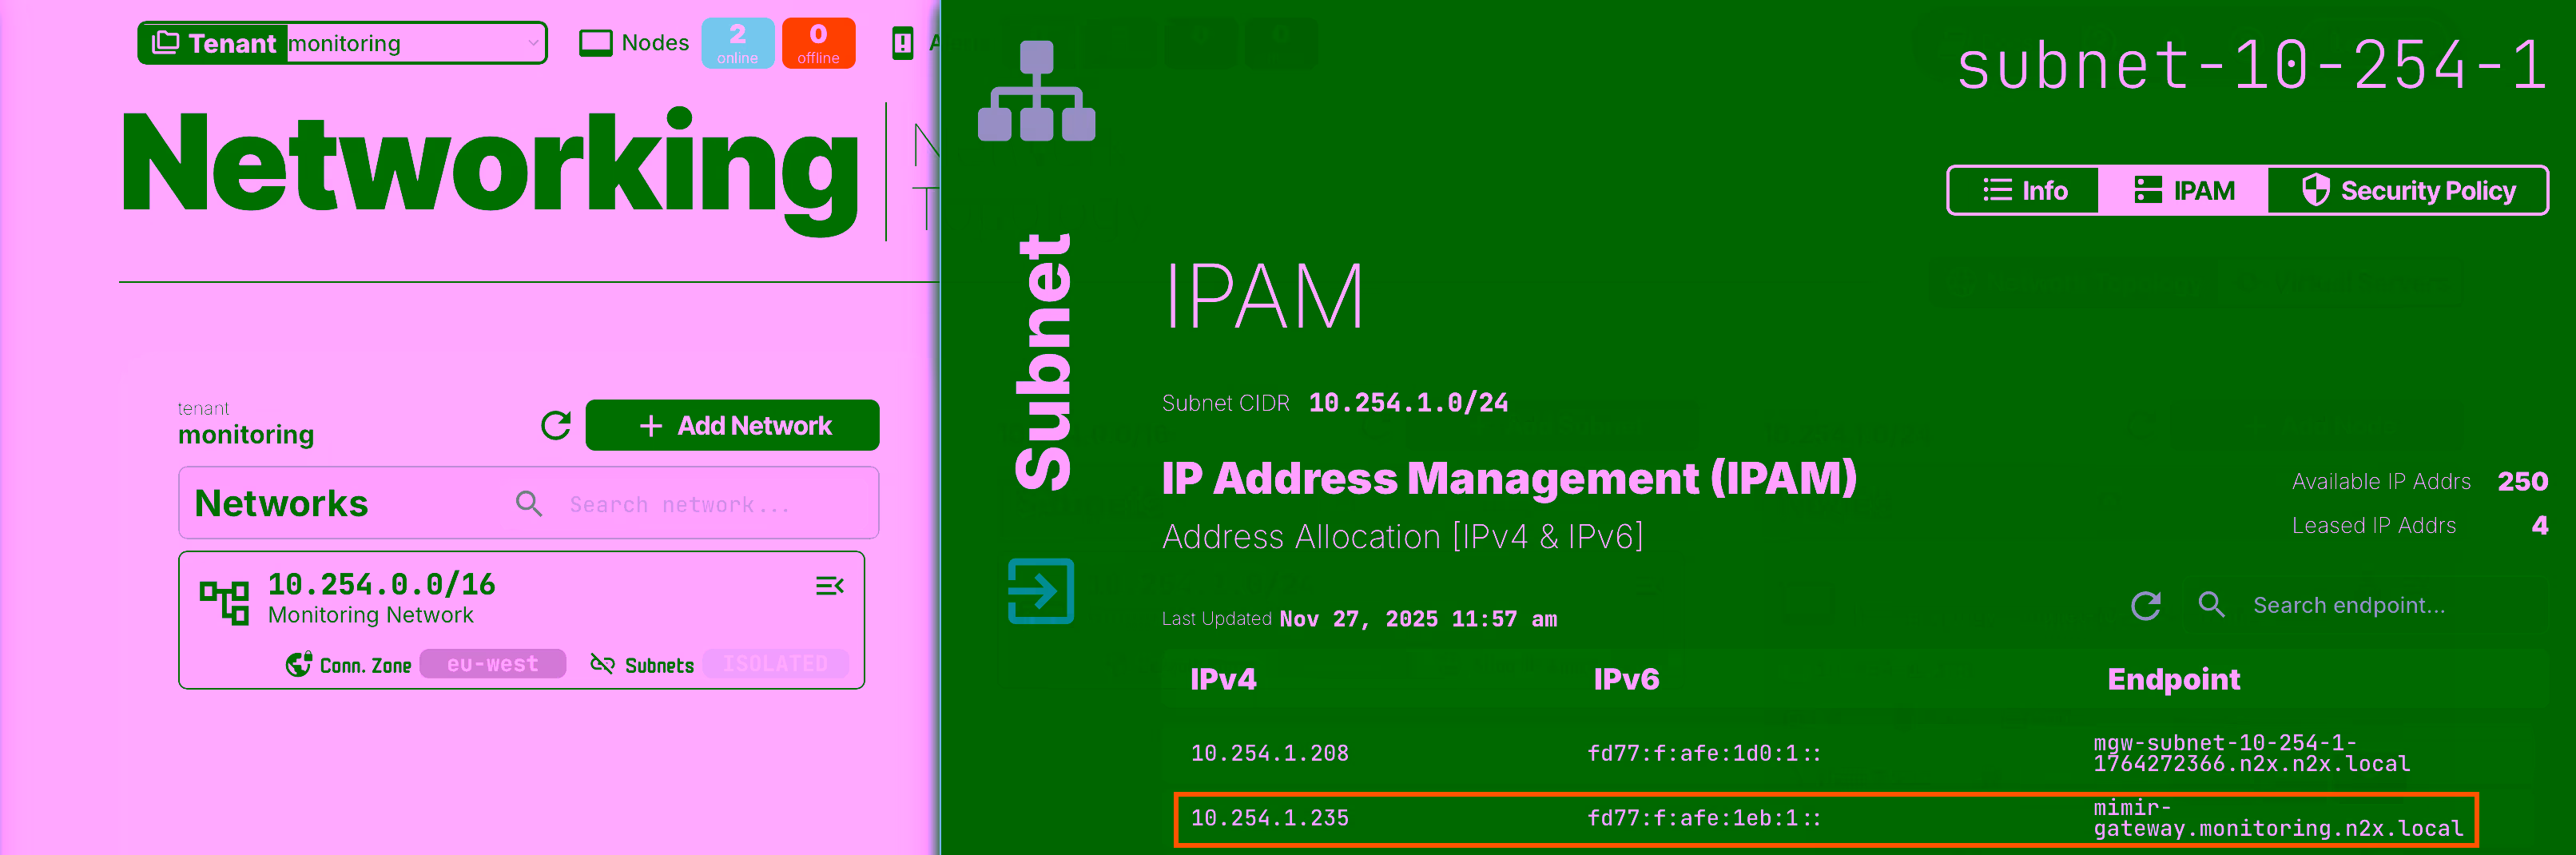
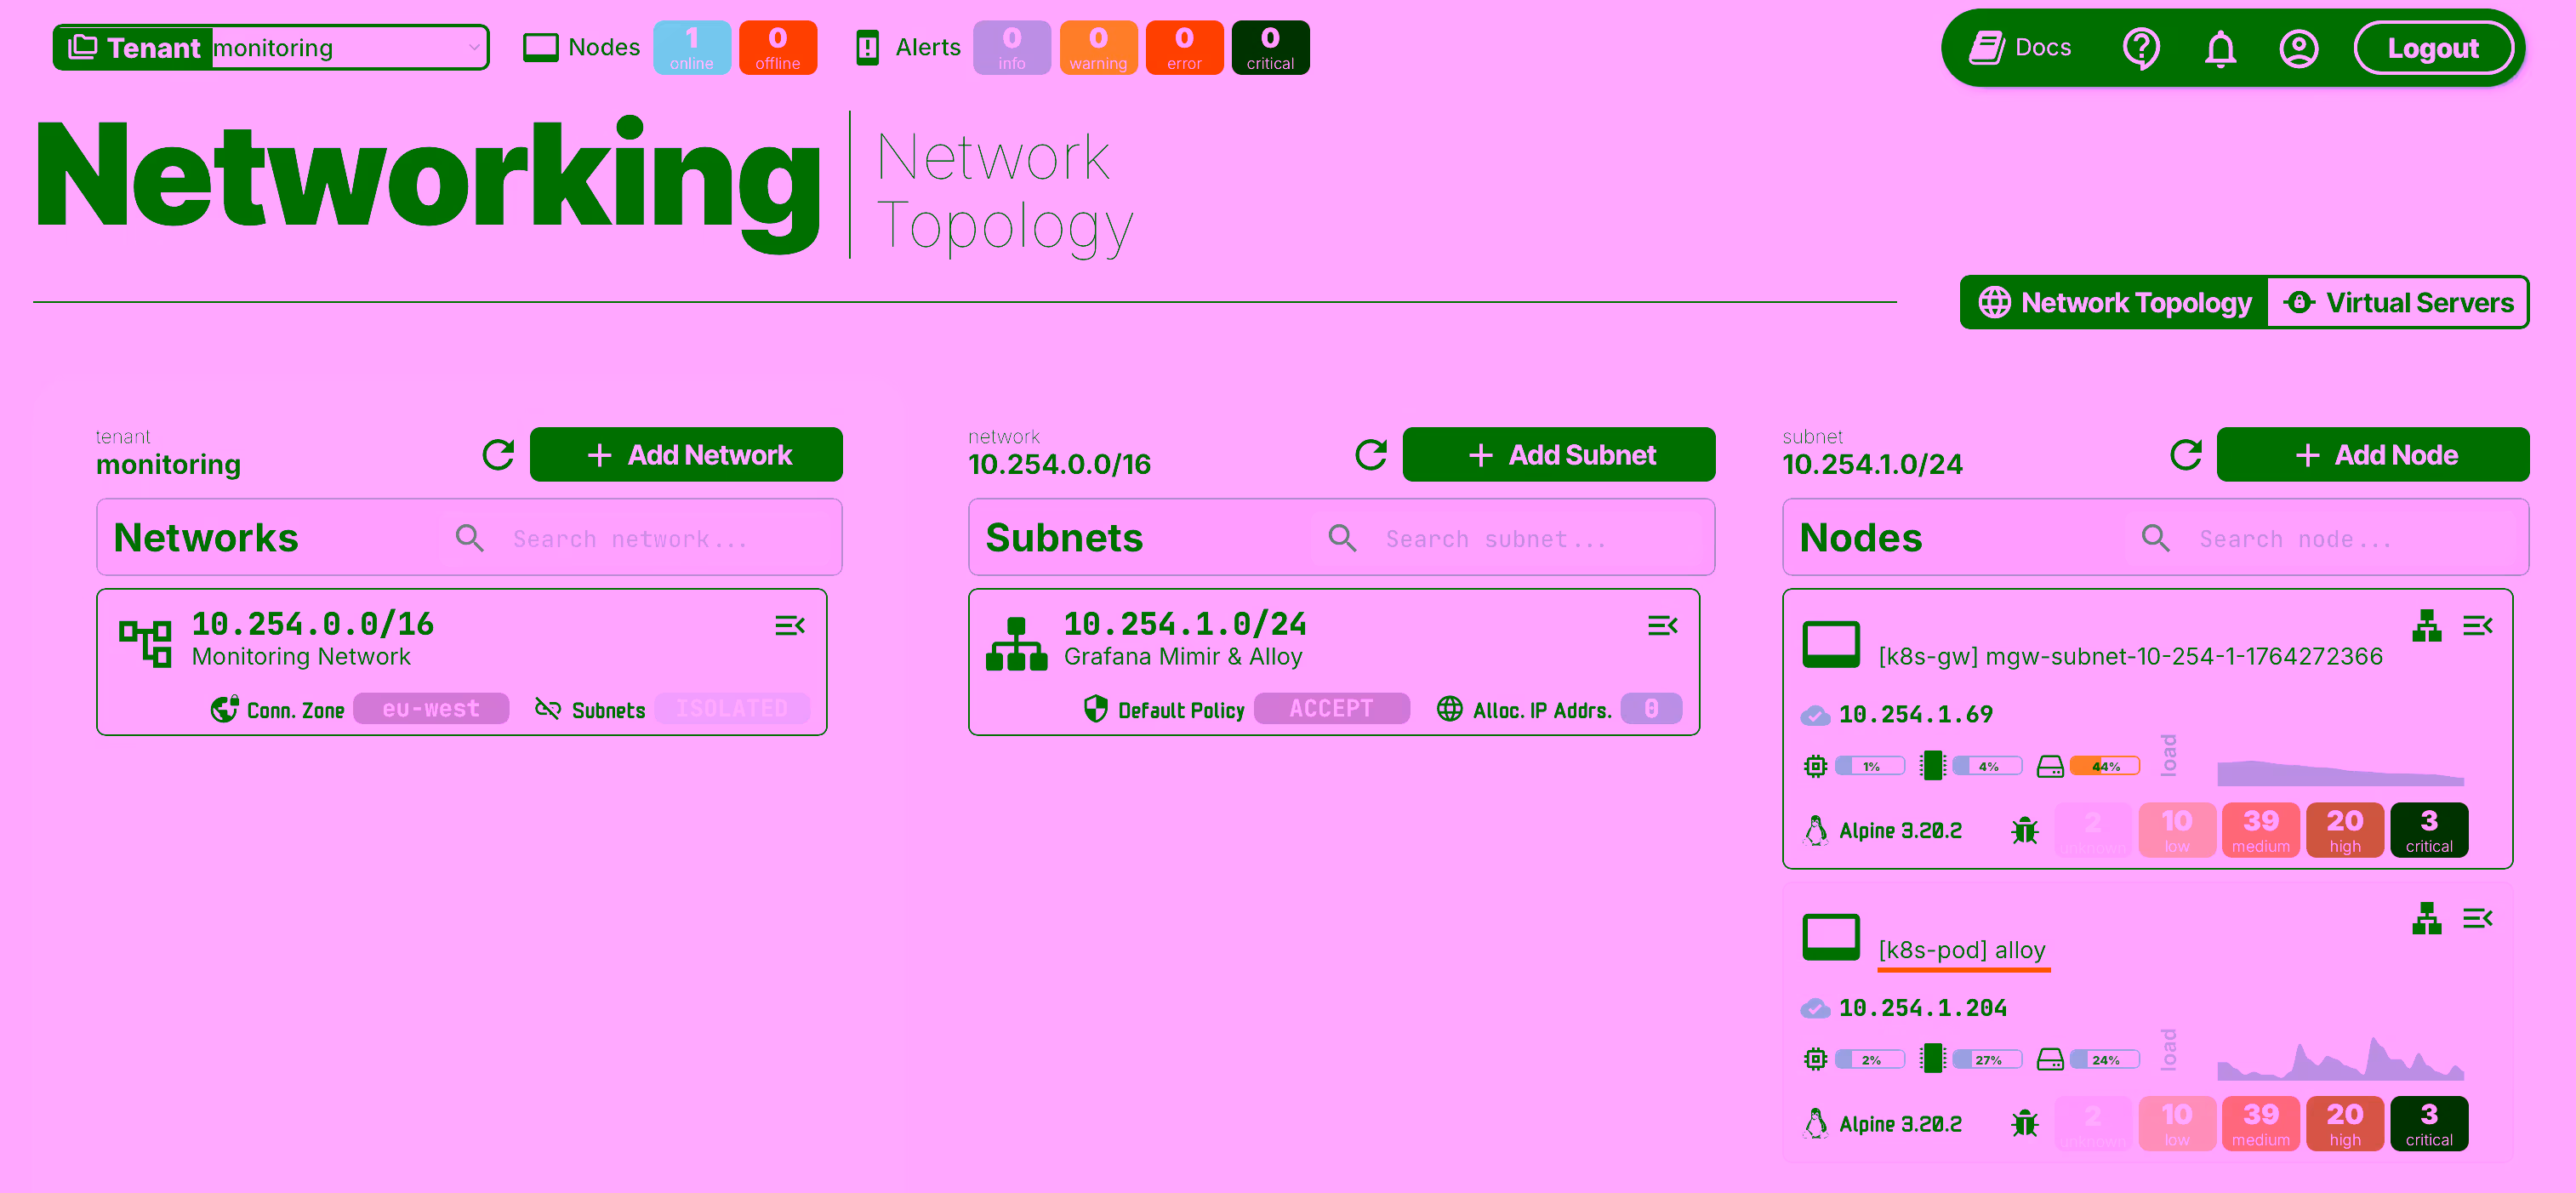
Now we can access the n2x.io WebUI to verify that the Grafana Mimir are correctly connected to the subnet.
Step 3: Install Grafana Alloy on a private cluster
Setting your context to Kubernetes Private cluster:
kubectl config use-context k8s-private
We are going to deploy a Grafana Alloy on a k8s-private cluster using the official Helm chart:
-
First, let’s add the following Helm repo:
helm repo add grafana https://grafana.github.io/helm-charts -
Update all the repositories to ensure helm is aware of the latest versions:
helm repo update -
Create the ConfigMap
alloy-config.yamlwith this information:apiVersion: v1 kind: ConfigMap metadata: name: alloy-config namespace: monitoring data: config.alloy: | logging { level = "info" format = "logfmt" } prometheus.remote_write "mimir" { external_labels = { infra = "k8s-private", } endpoint { url = "http://mimir-gateway.monitoring.svc:80/api/v1/push" headers = { "X-Scope-OrgID" = "monitoring", } remote_timeout = "30s" send_exemplars = true queue_config { capacity = 5000 max_shards = 5 } } } prometheus.exporter.unix "host" { rootfs_path = "/host/root" procfs_path = "/host/proc" sysfs_path = "/host/sys" } prometheus.scrape "node" { targets = prometheus.exporter.unix.host.targets job_name = "node" scrape_interval = "30s" forward_to = [prometheus.remote_write.mimir.receiver] } discovery.kubernetes "nodes" { role = "node" } discovery.relabel "cadvisor" { targets = discovery.kubernetes.nodes.targets rule { source_labels = ["__address__"] regex = "([^:]+)(?::\\d+)?" replacement = "$1:10250" target_label = "__address__" } rule { source_labels = ["__meta_kubernetes_node_name"] target_label = "node" } rule { replacement = "/metrics/cadvisor" target_label = "__metrics_path__" } } prometheus.scrape "cadvisor" { targets = discovery.relabel.cadvisor.output job_name = "cadvisor" scheme = "https" bearer_token_file = "/var/run/secrets/kubernetes.io/serviceaccount/token" scrape_interval = "30s" tls_config { insecure_skip_verify = true } forward_to = [prometheus.remote_write.mimir.receiver] }About
alloy-configConfigMap:- Remote write to Mimir: The
prometheus.remote_write "mimir"block sends all metrics tohttp://mimir-gateway.monitoring.svc:80/api/v1/push, adds the labelinfra = "k8s-private", and uses the headerX-Scope-OrgID = "monitoring"to identify the tenant. - Host metrics:
prometheus.exporter.unix "host"exposes system metrics using the mounted paths (/host/root,/host/proc,/host/sys), and theprometheus.scrape "node"scrape job collects them every30swithjob_name = "node"and forwards them to Mimir. - Discovery and cAdvisor metrics:
discovery.kubernetes "nodes"discovers cluster nodes,discovery.relabel "cadvisor"adjusts the address, labels, and path for the kubelet at:10250/metrics/cadvisor, andprometheus.scrape "cadvisor"scrapes container metrics every30sand sends them to Mimir as well. - Access to the Kubernetes API: The cAdvisor scrape uses the
ServiceAccounttoken (bearer_token_file) and a TLS configuration withinsecure_skip_verify = true, which is suitable for lab environments but should be hardened for production.
- Remote write to Mimir: The
-
Create the configuration file
values.yamlwith this information:crds: create: false alloy: configMap: create: false name: alloy-config key: config.alloy securityContext: privileged: false runAsUser: 0 runAsNonRoot: false capabilities: drop: - ALL enableReporting: false mounts: extra: - name: rootfs mountPath: /host/root readOnly: true mountPropagation: HostToContainer - name: sys mountPath: /host/sys readOnly: true mountPropagation: HostToContainer - name: proc mountPath: /host/proc readOnly: true mountPropagation: HostToContainer resources: limits: memory: 256Mi requests: cpu: 100m memory: 128Mi extraArgs: - --stability.level=generally-available serviceAccount: create: true name: alloy-sa rbac: create: true controller: type: daemonset hostNetwork: true hostPID: true dnsPolicy: ClusterFirstWithHostNet volumes: extra: - name: rootfs hostPath: path: / - name: sys hostPath: path: /sys - name: proc hostPath: path: /proc tolerations: - effect: NoSchedule key: node-role.kubernetes.io/control-plane operator: Exists - effect: NoSchedule key: node-role.kubernetes.io/master operator: ExistsAbout Alloy Helm values:
- CRDs and config:
crds.create: falseandalloy.configMap.create: falseindicate that CRDs are not managed by this chart and Alloy will load its configuration from an existing ConfigMap namedalloy-configwith keyconfig.alloy. - Security context: Alloy runs as
root(runAsUser: 0,runAsNonRoot: false) but without extra Linux capabilities (capabilities.drop: [ALL]) andprivileged: false, balancing host access needs with a reduced privilege set. - Host filesystem mounts: Extra mounts (
/host/root,/host/sys,/host/proc) are provided viamounts.extraand backed byhostPathvolumes in the controller section so Alloy can read host and kernel metrics while keeping mounts read-only. - Controller and scheduling: The controller runs as a
DaemonSetwithhostNetwork: true,hostPID: true, anddnsPolicy: ClusterFirstWithHostNet, ensuring one Alloy instance per node with direct access to host networking and process namespaces. Tolerations allow scheduling on control-plane/master nodes as well. - Service account and RBAC: A dedicated
ServiceAccount(alloy-sa) and RBAC resources are created, enabling Alloy to access Kubernetes APIs required for discovery and scraping. - Resources and runtime options: Resource requests/limits are modest (
100mCPU,128–256Mimemory) andextraArgssets--stability.level=generally-available, aligning with Alloy’s recommended stability level.
- CRDs and config:
-
Go ahead and deploy Grafana Alloy into your Kubernetes cluster by executing the following command:
Apply Grafana Alloy ConfigMap:
kubectl apply -f alloy-config.yamlDeploy Grafana Alloy with Helm:
helm install alloy grafana/alloy -f values.yaml -n monitoring --create-namespace --version 1.4.0 --wait --timeout 400s -
Run the following command to check the alloy Pod is in Running state:
kubectl get pods -n monitoring -l app.kubernetes.io/instance=alloyNAME READY STATUS RESTARTS AGE alloy-cptdc 2/2 Running 0 56s alloy-fm2ln 2/2 Running 0 56s
Step 4: Install Grafana Alloy on a public cluster
Setting your context to Kubernetes public cluster:
kubectl config use-context k8s-public
We are going to deploy a Grafana Alloy on a k8s-public cluster using the official Helm chart:
-
First, let’s add the following Helm repo:
helm repo add grafana https://grafana.github.io/helm-charts -
Update all the repositories to ensure helm is aware of the latest versions:
helm repo update -
Create the ConfigMap
alloy-config.yamlwith this information:apiVersion: v1 kind: ConfigMap metadata: name: alloy-config namespace: monitoring data: config.alloy: | logging { level = "info" format = "logfmt" } prometheus.remote_write "mimir" { external_labels = { infra = "k8s-public", } endpoint { url = "http://<MIMIR_IP_ADDRESS>:80/api/v1/push" headers = { "X-Scope-OrgID" = "monitoring", } remote_timeout = "30s" send_exemplars = true queue_config { capacity = 5000 max_shards = 5 } } } prometheus.exporter.unix "host" { rootfs_path = "/host/root" procfs_path = "/host/proc" sysfs_path = "/host/sys" } prometheus.scrape "node" { targets = prometheus.exporter.unix.host.targets job_name = "node" scrape_interval = "30s" forward_to = [prometheus.remote_write.mimir.receiver] } discovery.kubernetes "nodes" { role = "node" } discovery.relabel "cadvisor" { targets = discovery.kubernetes.nodes.targets rule { source_labels = ["__address__"] regex = "([^:]+)(?::\\d+)?" replacement = "$1:10250" target_label = "__address__" } rule { source_labels = ["__meta_kubernetes_node_name"] target_label = "node" } rule { replacement = "/metrics/cadvisor" target_label = "__metrics_path__" } } prometheus.scrape "cadvisor" { targets = discovery.relabel.cadvisor.output job_name = "cadvisor" scheme = "https" bearer_token_file = "/var/run/secrets/kubernetes.io/serviceaccount/token" scrape_interval = "30s" tls_config { insecure_skip_verify = true } forward_to = [prometheus.remote_write.mimir.receiver] }About
alloy-configConfigMap (k8s-public):- Purpose: Defines the Grafana Alloy configuration on the
k8s-publiccluster to collect node and container metrics and send them to the central Grafana Mimir instance over the n2x.io overlay network. - Remote write to Mimir: The
prometheus.remote_write "mimir"block sends all metrics tohttp://<MIMIR_IP_ADDRESS>:80/api/v1/push, adds the labelinfra = "k8s-public", and uses the headerX-Scope-OrgID = "monitoring"to identify the tenant. - Host metrics:
prometheus.exporter.unix "host"exposes host-level system metrics using the mounted paths (/host/root,/host/proc,/host/sys), and theprometheus.scrape "node"job scrapes them every30swithjob_name = "node"and forwards them to Mimir. - Discovery and cAdvisor metrics:
discovery.kubernetes "nodes"discovers Kubernetes nodes, whilediscovery.relabel "cadvisor"rewrites the target address to:10250, sets thenodelabel, and configures the scrape path to/metrics/cadvisor. Theprometheus.scrape "cadvisor"job then scrapes container metrics over HTTPS every30sand sends them to Mimir as well. - Kubernetes API access: The cAdvisor scrape uses the
ServiceAccounttoken (bearer_token_file) and a TLS config withinsecure_skip_verify = true, which is acceptable for lab environments but should be hardened for production deployments.
Info
You can find the IP address assigned to
mimir-gatewayservice by navigating to the n2x.io WebUI and going to theNetwork Topologysection. Locate the mimir-gateway service within your subnet, and you’ll see its assigned IP address in the IPAM table. - Purpose: Defines the Grafana Alloy configuration on the
-
Create the configuration file
values.yamlwith this information:crds: create: false alloy: configMap: create: false name: alloy-config key: config.alloy securityContext: privileged: false runAsUser: 0 runAsNonRoot: false capabilities: drop: - ALL enableReporting: false mounts: extra: - name: rootfs mountPath: /host/root readOnly: true mountPropagation: HostToContainer - name: sys mountPath: /host/sys readOnly: true mountPropagation: HostToContainer - name: proc mountPath: /host/proc readOnly: true mountPropagation: HostToContainer resources: limits: memory: 256Mi requests: cpu: 100m memory: 128Mi extraArgs: - --stability.level=generally-available serviceAccount: create: true name: alloy-sa rbac: create: true controller: type: daemonset hostNetwork: true hostPID: true dnsPolicy: ClusterFirstWithHostNet volumes: extra: - name: rootfs hostPath: path: / - name: sys hostPath: path: /sys - name: proc hostPath: path: /procAbout Alloy Helm values (k8s-public):
- CRDs and config:
crds.create: falseandalloy.configMap.create: falsemean the chart does not manage CRDs and Alloy loads its configuration from an existing ConfigMap namedalloy-configwith keyconfig.alloy. - Security context: Alloy runs as
root(runAsUser: 0,runAsNonRoot: false) withprivileged: falseand all Linux capabilities dropped (capabilities.drop: [ALL]), providing the required host access with a reduced privilege set. - Host filesystem mounts: Additional mounts (
/host/root,/host/sys,/host/proc) are defined undermounts.extraand backed byhostPathvolumes so Alloy can read host and kernel metrics while keeping these mounts read-only. - Service account and RBAC: A dedicated
ServiceAccount(alloy-sa) and RBAC resources are created, allowing Alloy to interact with the Kubernetes API for discovery and scraping. - Controller and scheduling: The controller runs as a
DaemonSetwithhostNetwork: true,hostPID: true, anddnsPolicy: ClusterFirstWithHostNet, ensuring one Alloy instance per node with direct access to host networking and process namespaces. Unlike the private cluster configuration, no tolerations are set, so Alloy will not be scheduled onto control-panel/master nodes in the public cluster. - Resources and runtime options: Resource requests/limits are modest (
100mCPU,128–256Mimemory) andextraArgssets--stability.level=generally-available, aligning with Alloy’s recommended stability level.
- CRDs and config:
-
Go ahead and deploy Grafana Alloy into your Kubernetes cluster by executing the following command:
Create
monitoringnamespace:kubectl create namespace monitoringApply Grafana Alloy ConfigMap:
kubectl apply -f alloy-config.yamlDeploy Grafana Alloy with Helm:
helm install alloy grafana/alloy -f values.yaml -n monitoring --create-namespace --version 1.4.0 --wait --timeout 400s -
Run the following command to check the alloy Pod is in Running state:
kubectl get pods -n monitoring -l app.kubernetes.io/instance=alloyNAME READY STATUS RESTARTS AGE alloy-tmq58 2/2 Running 0 3m9s
Step 5: Connect Grafana Alloy to the n2x.io network topology in public cluster
Setting your context to Kubernetes Public cluster:
kubectl config use-context k8s-public
To connect a new kubernetes workloads to the n2x.io subnet, you can execute the following command:
n2xctl k8s workload connect
The command will typically prompt you to select the Tenant, Network, and Subnet from your available n2x.io topology options. Then, you can choose the workloads you want to connect by selecting it with the space key and pressing enter. In this case, we will select monitoring: alloy.
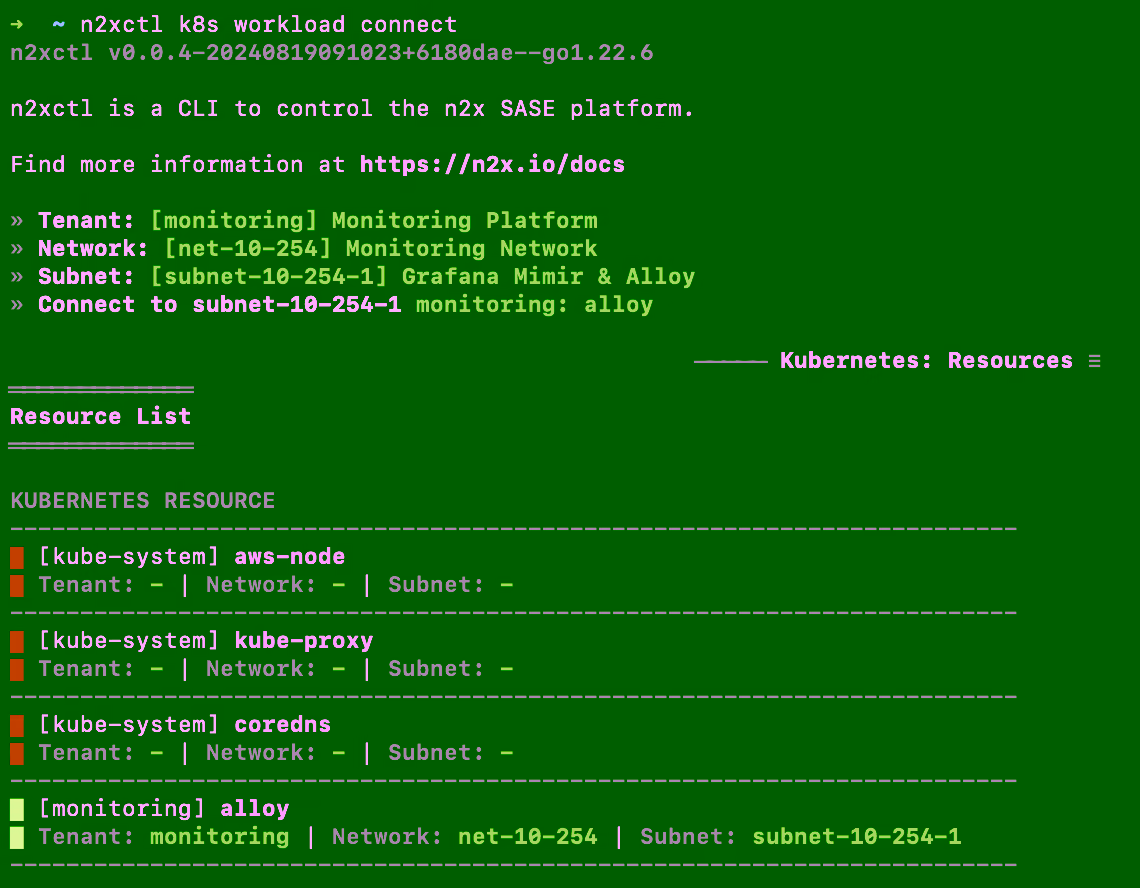
Now we can access the n2x.io WebUI to verify that the alloy workloads are correctly connected to the subnet.
Step 6: Connect server01 to our n2x.io network topology
Now we need to connect server01 to our n2x.io network topology so that Grafana Alloy can send metrics to Grafana Mimir.
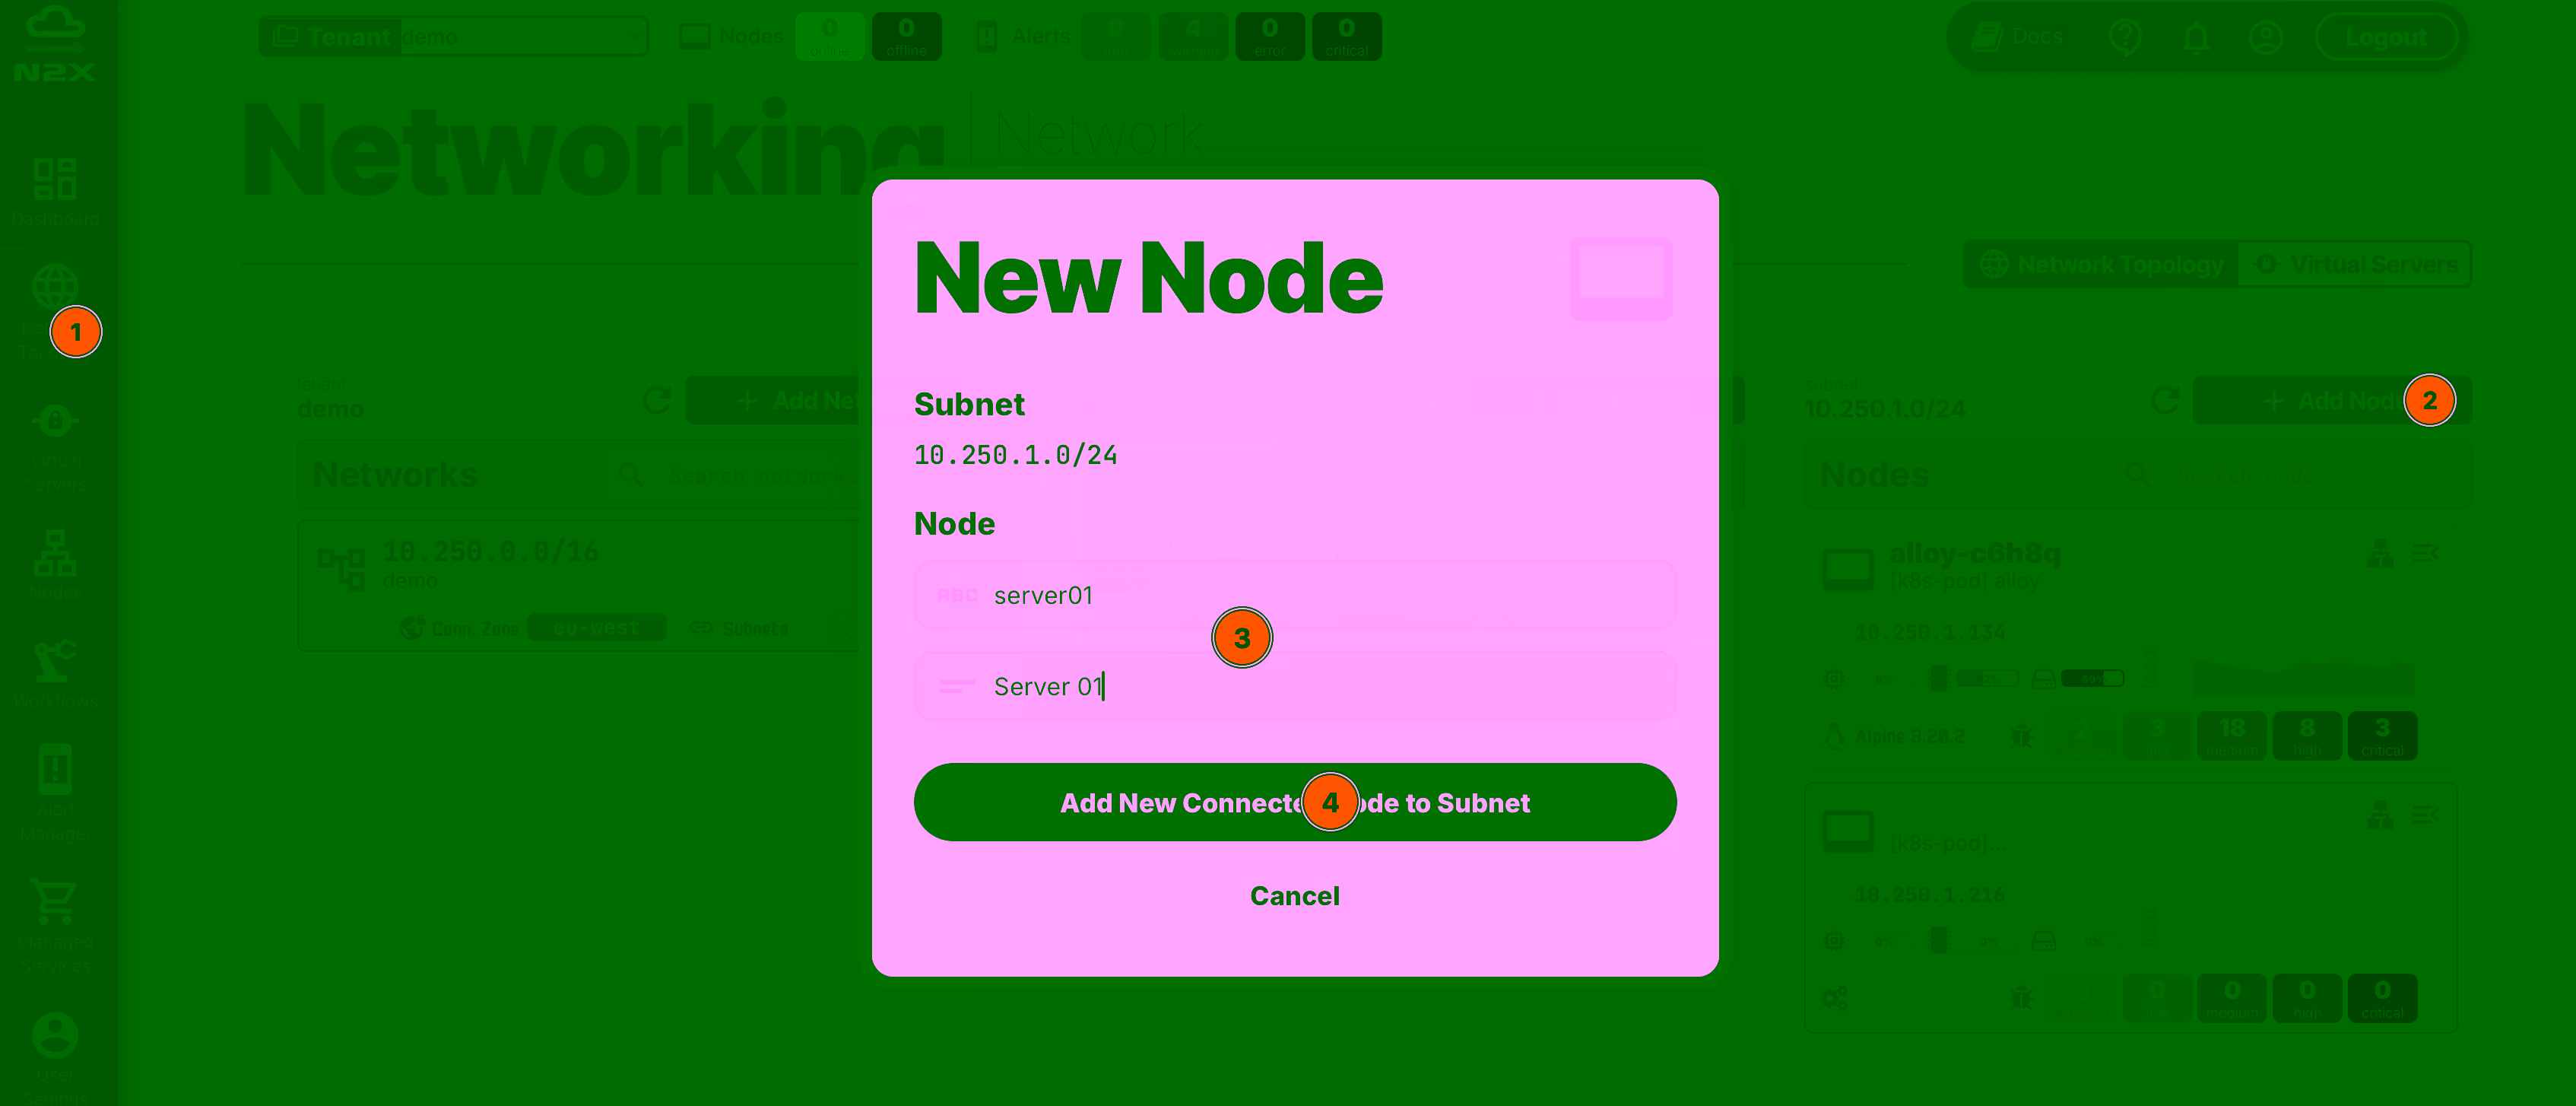
Adding a new node in a subnet with n2x.io is very easy. Here's how:
- Head over to the n2x WebUI and navigate to the
Network Topologysection in the left panel. - Click the
Add Nodebutton and ensure the new node is placed in the same subnet as theGrafana Mimir. - Assign a
nameanddescriptionfor the new node. - Click
Add New Connected Node to Subnet.
Here, we can select the environment where we are going to install the n2x-node agent. In this case, we are going to use Linux:
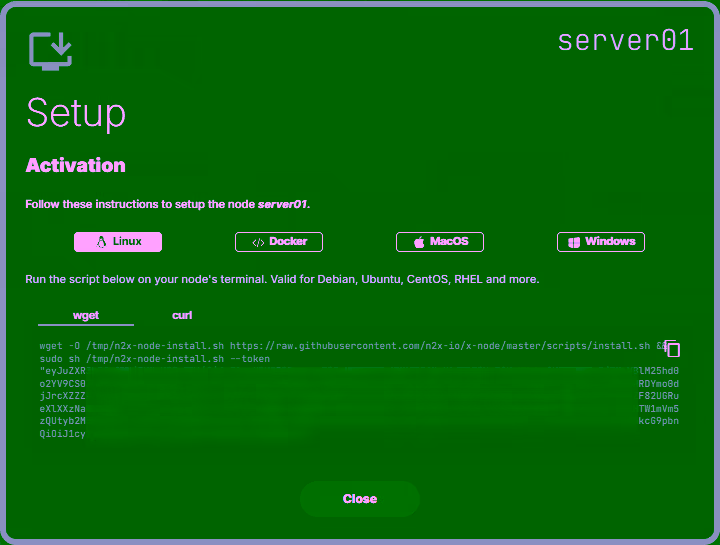
Run the script on server01 terminal and check if the service is running with the command:
systemctl status n2x-node
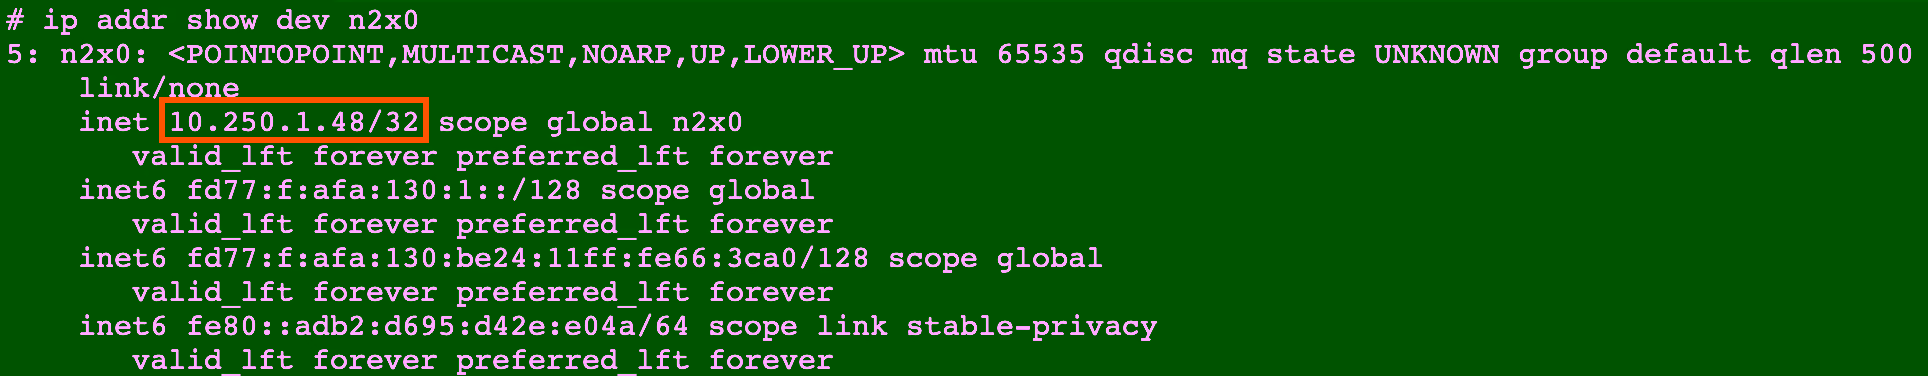
You can use ip addr show dev n2x0 command on server01 to display the IP address assigned to this node:
Step 7: Install Grafana Alloy in server01
We are going to deploy a Grafana Alloy on server01 using the official Grafana Alloy Docker image:
-
Create the configuration file
config.alloywith this information:logging { level = "info" format = "logfmt" } prometheus.remote_write "mimir" { external_labels = { infra = "dc-private", } endpoint { url = "http://<MIMIR_IP_ADDRESS>:80/api/v1/push" headers = { "X-Scope-OrgID" = "monitoring", } remote_timeout = "30s" send_exemplars = true } } prometheus.exporter.unix "host" { rootfs_path = "/rootfs" procfs_path = "/host/proc" sysfs_path = "/sys" } prometheus.exporter.cadvisor "dockerd" { docker_host = "unix:///var/run/docker.sock" storage_duration = "5m" } prometheus.scrape "host" { targets = prometheus.exporter.unix.host.targets job_name = "node" scrape_interval = "30s" forward_to = [prometheus.remote_write.mimir.receiver] } prometheus.scrape "containers" { targets = prometheus.exporter.cadvisor.dockerd.targets job_name = "cadvisor" scrape_interval = "30s" forward_to = [prometheus.remote_write.mimir.receiver] }About Alloy configuration (
dc-privateserver):- Logging: Sets Alloy logging to
level = "info"andformat = "logfmt", providing structured, human-readable logs. - Remote write to Mimir: The
prometheus.remote_write "mimir"block sends all metrics tohttp://<MIMIR_IP_ADDRESS>:80/api/v1/push, adds the labelinfra = "dc-private"to identify the data center site, and uses the headerX-Scope-OrgID = "monitoring"for tenant identification. It also configures a30sremote timeout and enables exemplars (send_exemplars = true). - Host metrics exporter:
prometheus.exporter.unix "host"exposes host-level system metrics using the mounted filesystem paths (/rootfs,/host/proc,/sys), suitable for a bare-metal or VM environment. - Container metrics exporter (cAdvisor):
prometheus.exporter.cadvisor "dockerd"scrapes container metrics directly from the local Docker engine viaunix:///var/run/docker.sock, with astorage_durationof5m. - Scrape jobs:
prometheus.scrape "host"scrapes the host exporter targets every30swithjob_name = "node"and forwards the metrics to Mimir.prometheus.scrape "containers"scrapes the cAdvisor exporter targets every30swithjob_name = "cadvisor"and also forwards the metrics to Mimir.- Overall purpose: Collects both host and container metrics from the
dc-privateserver and ships them to the central Grafana Mimir backend, keeping this site distinguishable via theinfralabel.
Info
You can find the IP address assigned to
mimir-gatewayservice by navigating to the n2x.io WebUI and going to theNetwork Topologysection. Locate the mimir-gateway service within your subnet, and you’ll see its assigned IP address in the IPAM table. - Logging: Sets Alloy logging to
-
Create the
docker-compose.yamlfile with this information:services: alloy: container_name: alloy image: grafana/alloy:v1.10.1 command: - run - --server.http.listen-addr=127.0.0.1:12345 - --storage.path=/var/lib/alloy - /etc/alloy/config.alloy network_mode: host pid: host privileged: true restart: always volumes: - ./config.alloy:/etc/alloy/config.alloy:ro - /:/rootfs:ro,rslave - /etc/hostname:/etc/hostname:ro - /proc:/host/proc:ro - /sys:/sys:ro - /dev/disk:/dev/disk:ro - /var/run/docker.sock:/var/run/docker.sock:ro -
Now, we can start Grafana Alloy by running the following command:
docker compose up -dWe can check the
alloycontainer is up and running with the following command:docker compose psNAME IMAGE COMMAND SERVICE CREATED STATUS PORTS alloy grafana/alloy:v1.10.1 "/bin/alloy run --se…" alloy About a minute ago Up About a minute -
We can verify that
alloyis running properly and exposing metrics with the following command:docker compose logs... alloy | ts=2025-12-01T15:41:28.367299765Z level=info msg="peers changed" service=cluster peers_count=1 min_cluster_size=0 peers=server01 alloy | ts=2025-12-01T15:41:28.367770305Z level=info msg="now listening for http traffic" service=http addr=127.0.0.1:12345 alloy | ts=2025-12-01T15:41:44.295403898Z level=info msg="Done replaying WAL" component_path=/ component_id=prometheus.remote_write.mimir subcomponent=rw remote_name=41a358 url=http://10.254.1.235:80/api/v1/push duration=15.968958357s
Step 8: Installing Grafana in Kubernetes private cluster worker node
Once our metrics are stored in Grafana Mimir, we'll need a way to analyze them. To achieve this, we'll deploy Grafana, a powerful visualization tool, on our private Kubernetes cluster using Helm:
Setting your context to Kubernetes Private cluster:
kubectl config use-context k8s-private
We are going to deploy a Grafana on a k8s-private cluster using the official Helm chart:
-
First, let’s add the following Helm repo:
helm repo add grafana https://grafana.github.io/helm-charts -
Update all the repositories to ensure helm is aware of the latest versions:
helm repo update -
Create the configuration file
values.yamlwith this information:datasources: datasources.yaml: apiVersion: 1 datasources: - name: Mimir uid: mimir type: prometheus access: proxy isDefault: true editable: true url: http://mimir-gateway.monitoring.svc:80/prometheus jsonData: httpMethod: POST timeInterval: "30s" prometheusType: Mimir prometheusVersion: "2.8.0" httpHeaderName1: "X-Scope-OrgID" secureJsonData: httpHeaderValue1: "monitoring" -
Install Grafana version
9.3.2with default configuration in themonitoringnamespace:helm install grafana grafana/grafana -n monitoring --create-namespace --version 9.3.2 -f values.yaml -
The Grafana pod should be up and running:
kubectl -n monitoring get pod -l app.kubernetes.io/name=grafanaNAME READY STATUS RESTARTS AGE grafana-7f5786dbfc-9srz9 1/1 Running 0 2m46s -
We can get the Grafana
adminuser password by running:kubectl get secret --namespace monitoring grafana -o jsonpath="{.data.admin-password}" | base64 --decode ; echo
All the deployments now are completed. It is time we set up our Grafana. We can port-forward the Grafana service and access the Grafana dashboard directly from http://localhost:8080/:
kubectl -n monitoring port-forward svc/grafana 8080:80
Info
You can login with admin user and password getting before.
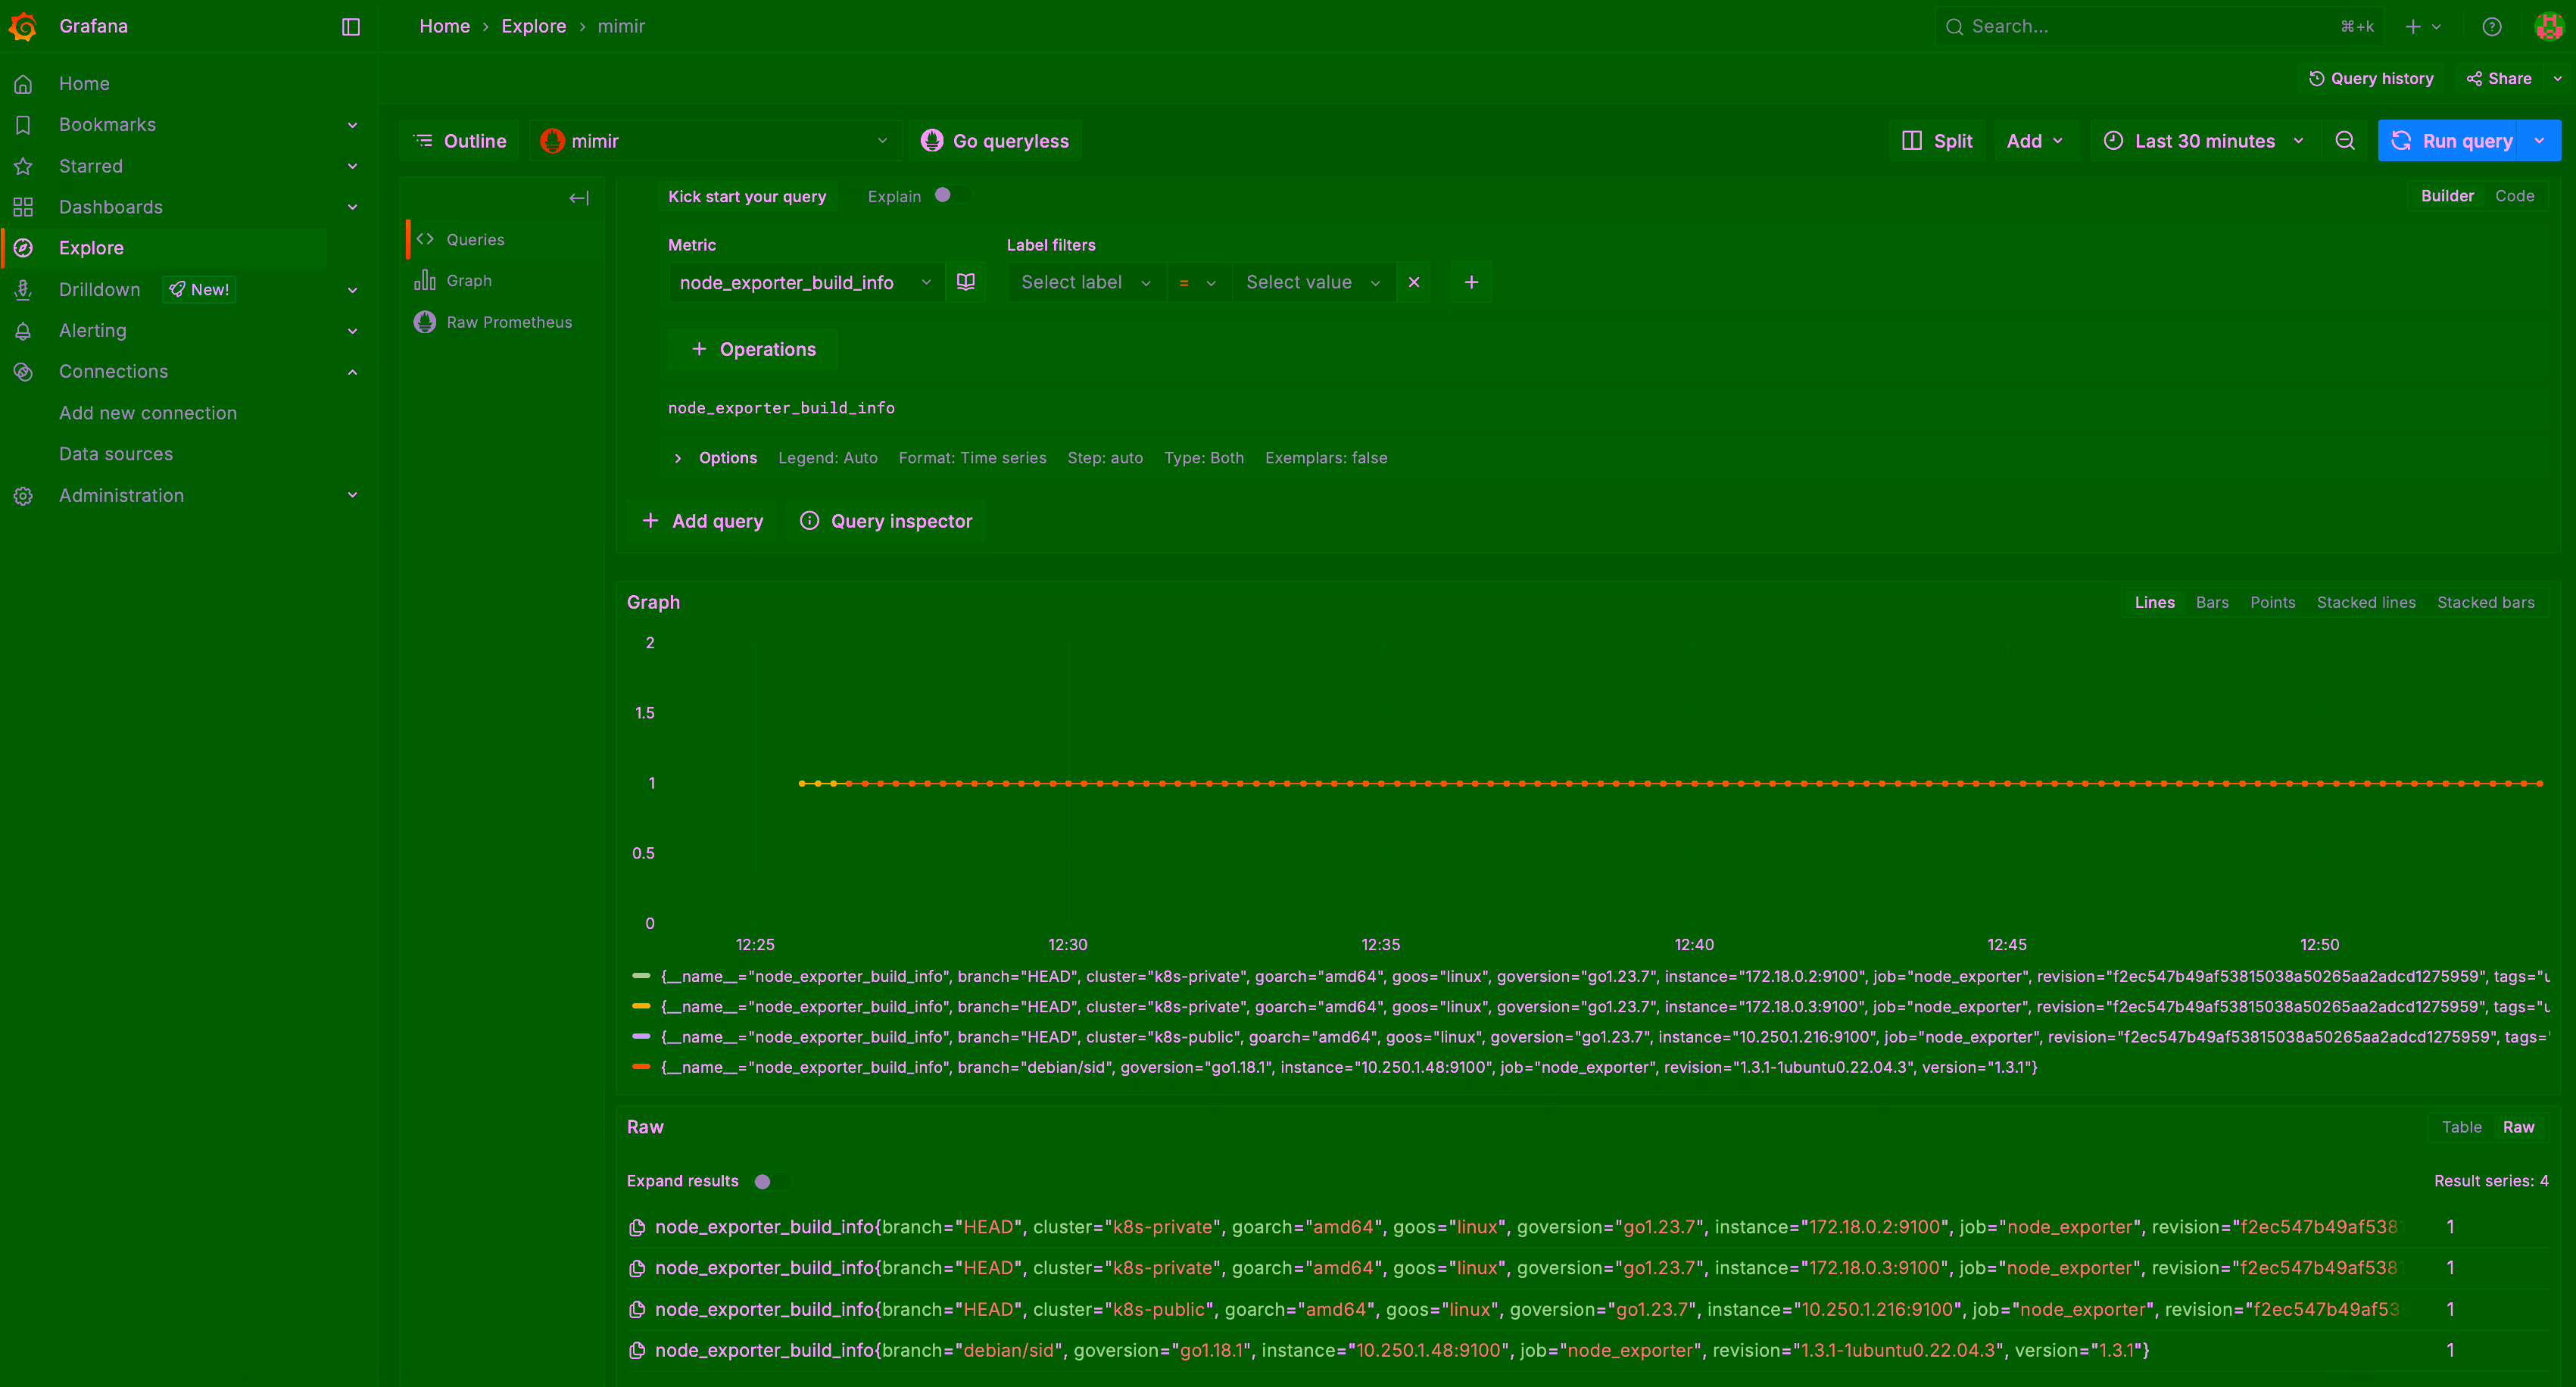
After this, we can check if the data are in successfully stored in Grafana Mimir. From Grafana Dashboard click in Explore, select the node_exporter_build_info query and select Run query:
Conclusion
In this guide, we demonstrated how n2x.io, integrated with Grafana Mimir and Grafana Alloy, provides a scalable, centralized architecture for collecting and analyzing metrics. By bridging physical servers and Kubernetes clusters across both private and public environments, this unified telemetry and networking setup empowers operations teams with a consistent and reliable observability layer.
This approach reduces the overhead of managing fragmented systems, simplifies troubleshooting, and ensures cohesive visibility across distributed infrastructure. For teams operating in complex, multi-site environments, it offers a solid foundation for building efficient, resilient monitoring pipelines.
To dive deeper into the challenges of fragmented tooling and the benefits of a unified observability strategy, we recommend reading Observability Tools as Data Silos of Troubleshooting.