Collecting Logs with Grafana Loki across Multiple Sites
In this tutorial, we will create a network topology using n2x.io that enables communications across a public Kubernetes cluster, a private Kubernetes cluster, and a Ubuntu server in a private data center. We will deploy the Grafana Loki stack in Kubernetes private cluster, and Promtail to collect logs in the Ubuntu server and Kubernetes public cluster worker node. Then we will access the Grafana Dashboard to query the collected logs.
Here is the high-level overview of our setup architecture:
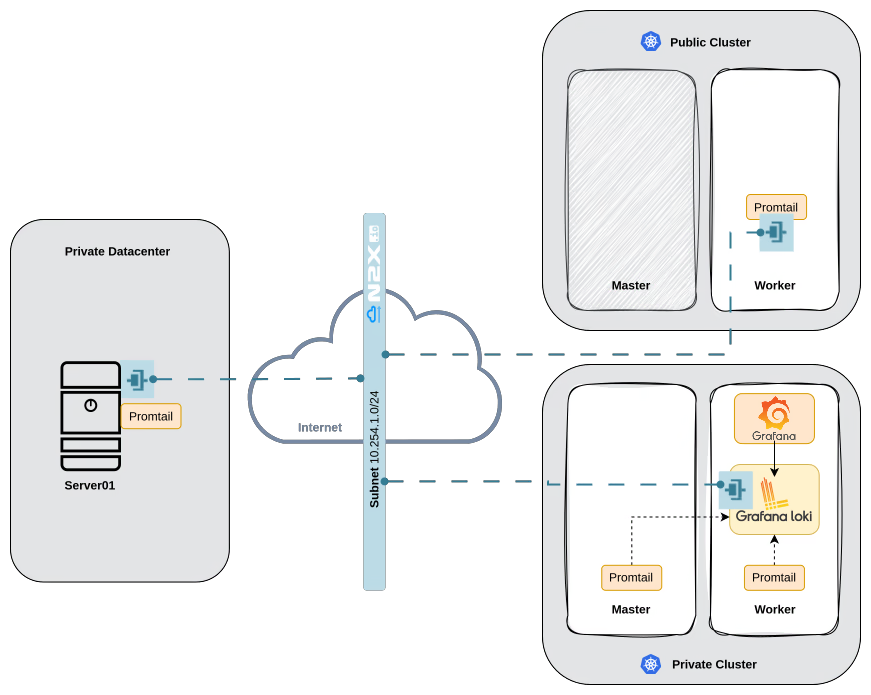
In our setup, we will be using the following components:
- Grafana is an analytics and interactive visualization platform. For more info please visit the Grafana Documentation
- Grafana Loki is a log aggregation system designed to store and query logs from all your applications and infrastructure. For more info please visit Grafana Loki Documentation.
- Promtail is an agent that ships the contents of local logs to a Grafana Loki. For more info please visit Promtail Documentation
- n2x-node is an open-source agent that runs on the machines you want to connect to your n2x.io network topology. For more info please visit n2x.io Documentation.
Before you begin
To follow along in this tutorial, you should meet the following requirements:
- Access to at least two Kubernetes clusters, version
v1.27.xor greater. - A n2x.io account created and one subnet with
10.254.1.0/24prefix. - Installed n2xctl command-line tool, version
v0.0.3or greater. - Installed kubectl command-line tool, version
v1.27.xor greater. - Installed helm command-line tool, version
v3.10.1or greater.
Note
Please note that this tutorial uses a Linux OS with an Ubuntu 22.04 (Jammy Jellyfish) with amd64 architecture.
Step-by-step Guide
Step 1: Installing Grafana Loki stack in Kubernetes private cluster
Setting your context to Kubernetes Private cluster:
kubectl config use-context k8s-private
We are going to deploy a Grafana Loki in monolithic mode on a k8s-private cluster using the official Helm chart:
-
Add Grafana’s chart repository to Helm:
helm repo add grafana https://grafana.github.io/helm-charts -
Update the chart repository:
helm repo update -
Create the configuration file
values.yamlwith this information:deploymentMode: SingleBinary loki: auth_enabled: false commonConfig: replication_factor: 1 storage: type: 'filesystem' schemaConfig: configs: - from: "2024-01-01" store: tsdb index: prefix: loki_index_ period: 24h object_store: filesystem # we're storing on filesystem so there's no real persistence here. schema: v13 singleBinary: replicas: 1 read: replicas: 0 backend: replicas: 0 write: replicas: 0 -
Install the
6.10.0version of Grafana Loki with the defined configuration:helm install --values values.yaml loki grafana/loki -n grafana-loki --create-namespace --version 6.10.0 -
Once it is done, you can verify if all of the pods in the
grafana-lokinamespace are up and running:kubectl -n grafana-loki get podNAME READY STATUS RESTARTS AGE loki-0 1/1 Running 0 84s loki-canary-zbv9r 1/1 Running 0 84s loki-chunks-cache-0 2/2 Running 0 84s loki-gateway-666b9dfb7-lj5wd 1/1 Running 0 84s loki-results-cache-0 2/2 Running 0 84s
We'll deploy a Promtail DaemonSet to collect logs from our Kubernetes private cluster:
-
We are going to use the official documentation to create a
promtail-k8s-private-ds.yamland execute the following command to replace the{YOUR_LOKI_ENDPOINT}:sed 's|https://{YOUR_LOKI_ENDPOINT}|http://loki-gateway.grafana-loki.svc.cluster.local|g' -i promtail-k8s-private-ds.yamlNote
By default, DaemonSets won't be scheduled on the Kubernetes master node due to a taint. If you specifically want the DaemonSet to run on the master node, you can add the following toleration to the
spec.template.specsection:tolerations: - key: node-role.kubernetes.io/control-plane effect: NoSchedule -
After that, we can apply the changes with this command:
3. And the Promtail pods should be up and running:kubectl apply -f promtail-k8s-private-ds.yamlkubectl get podNAME READY STATUS RESTARTS AGE promtail-daemonset-2f87x 1/1 Running 0 19s promtail-daemonset-v9d2j 1/1 Running 0 20s
Once our logs are collected and stored in Grafana Loki, we'll need a way to analyze them. To achieve this, we'll deploy Grafana, a powerful visualization tool, on our private Kubernetes cluster using Helm:
-
Install Grafana version
8.4.5with default configuration in thegrafananamespace:2. The Grafana pod should be up and running:helm install grafana grafana/grafana -n grafana --create-namespace --version 8.4.5kubectl -n grafana get pod3. We can get the GrafanaNAME READY STATUS RESTARTS AGE grafana-6644c7b769-f6prd 1/1 Running 0 3m5sadminuser password by running:kubectl get secret --namespace grafana grafana -o jsonpath="{.data.admin-password}" | base64 --decode ; echo
All the deployments now are completed. It is time we set up our Grafana. We can port-forward the Grafana service and access the Grafana dashboard directly from http://localhost:8080/:
kubectl -n grafana port-forward svc/grafana 8080:80
Info
You can login with admin user and password getting before.
Now, as a next step, we need to add Grafana Loki as a data source (Home > Connections > Data Sources > Add data source):

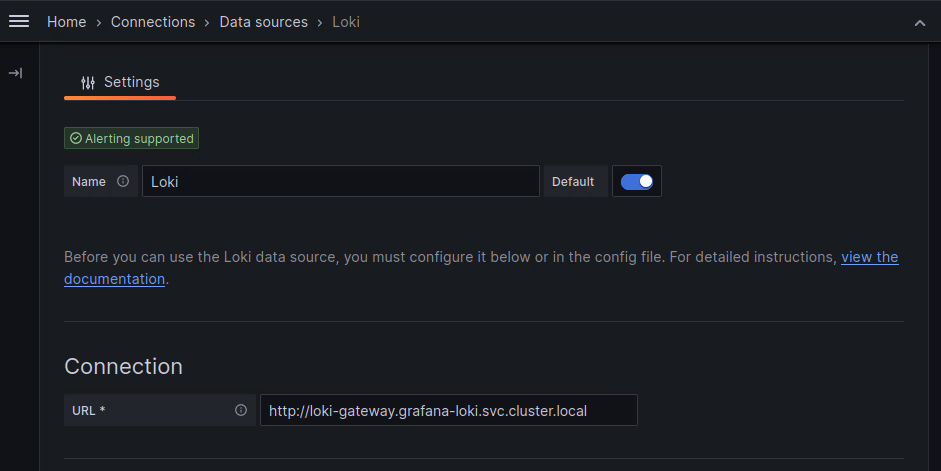
For the Connection URL, enter the endpoint of the Grafana Loki gateway service: http://loki-gateway.grafana-loki.svc.cluster.local. Then, click Save & test.
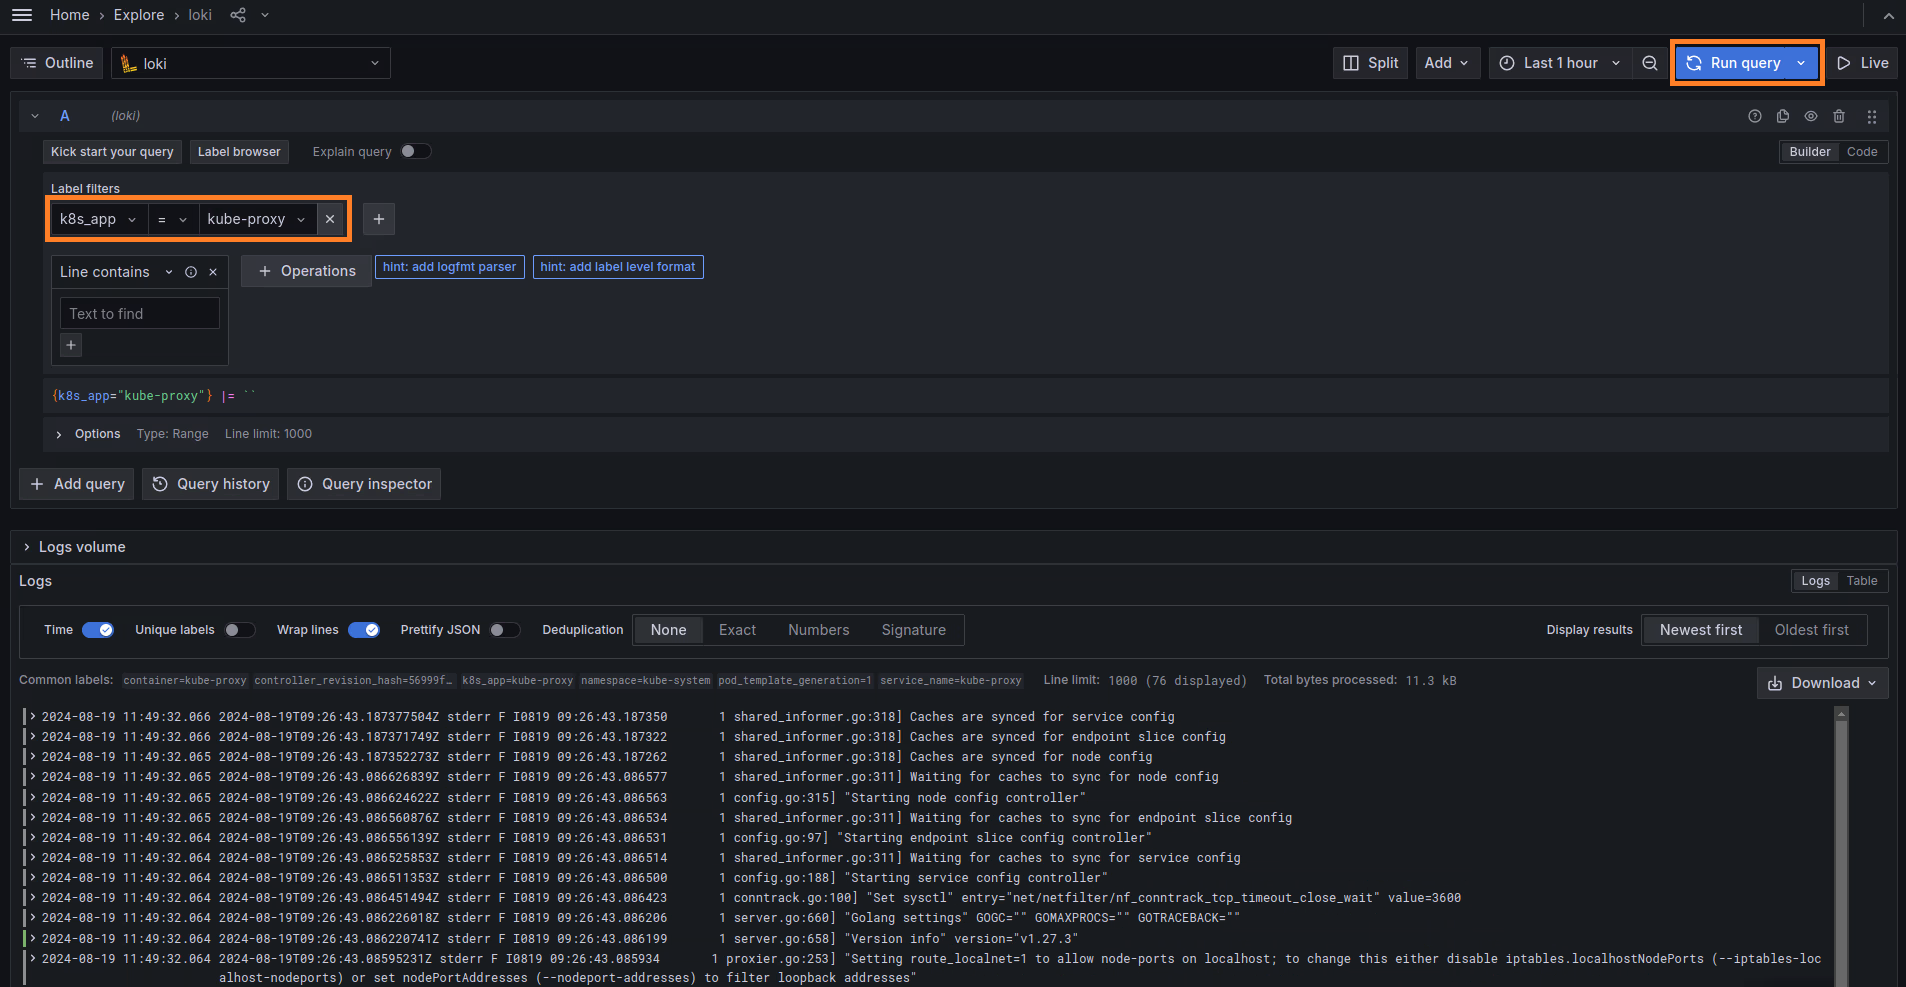
Now we can query the data stored in Loki. Click the Explore button, select your desired query (e.g., k8s_app = kube-proxy), and then click Run query.

Step 2: Connecting Grafana Loki to our n2x.io network topology
Promtail agents must be able to reach the Grafana Loki Gateway to successfully send logs. So, we need connect to Grafana Loki Gateway to n2x.io network topology.
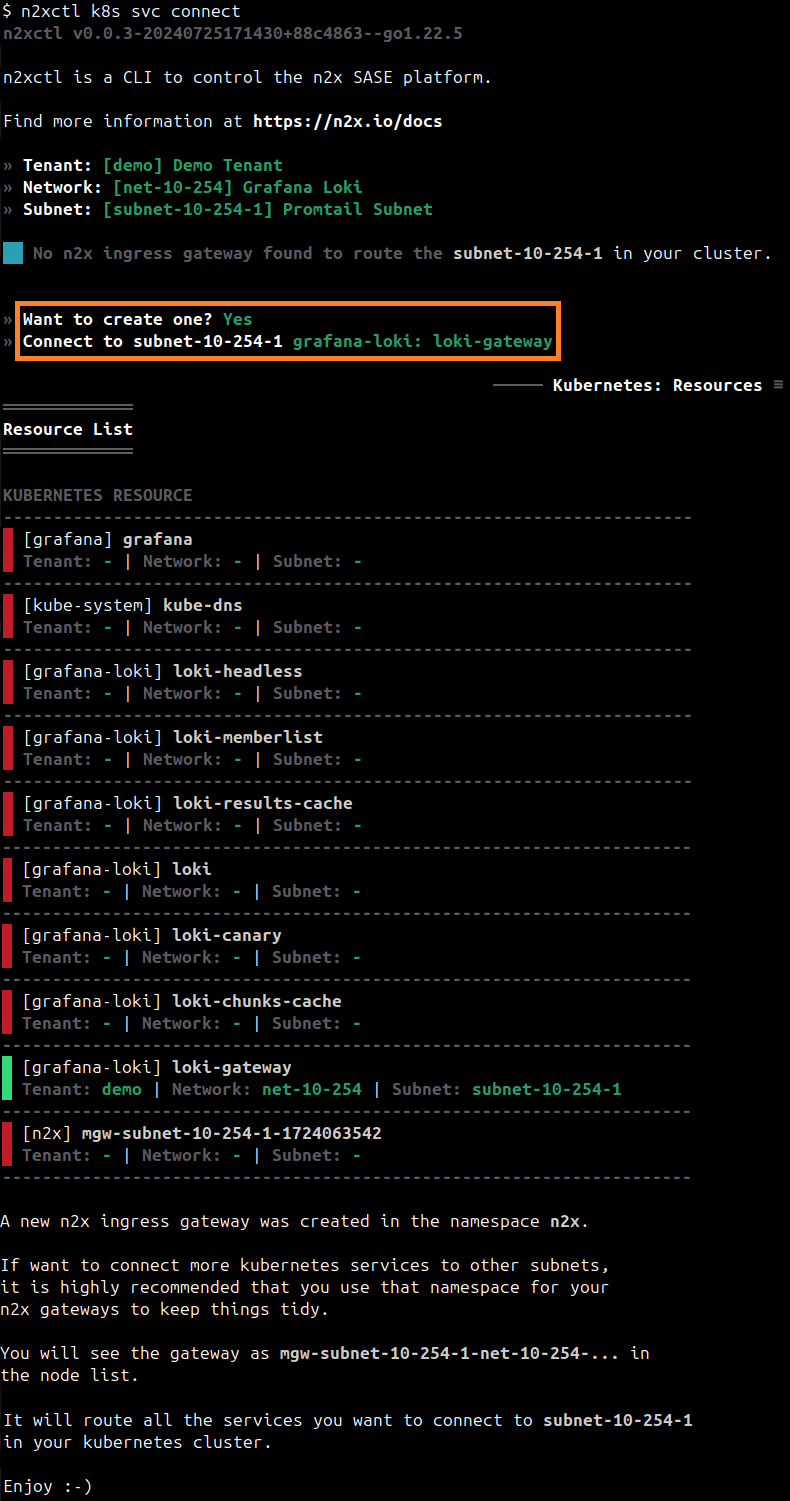
To connect a new kubernetes service to the n2x.io subnet, you can execute the following command:
n2xctl k8s svc connect
The command will typically prompt you to select the Tenant, Network, and Subnet from your available n2x.io topology options. Then, you can choose the service you want to connect by selecting it with the space key and pressing enter. In this case, we will select grafana-loki: loki-gateway.
Note
The first time that you connect a k8s svc to the subnet, you need to deploy a n2x.io Kubernetes Gateway.
Finding IP address assigned to the Grafana Loki Gateway Service:
-
Access the n2x.io WebUI and log in.
-
In the left menu, click on the
Network Topologysection and choose thesubnetassociated with your Grafana Loki Gateway Service (e.g., subnet-10-254-0). -
Click on the
IPAMsection. Here, you'll see both IPv4 and IPv6 addresses assigned to theloki-gateway.grafana-loki.n2x.localendpoint. Identify the IP address you need for your specific use case.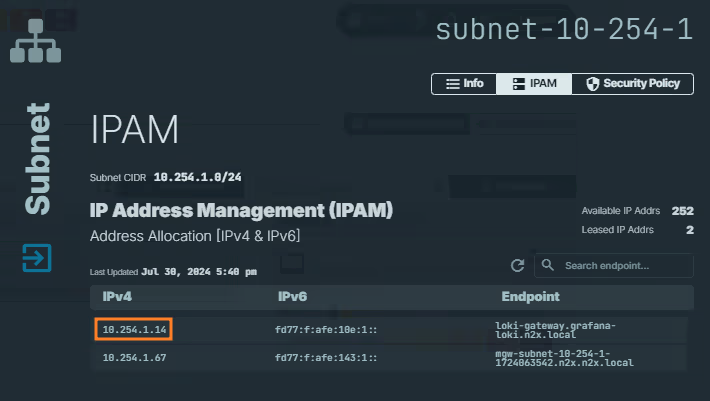
Info
Remember the IP address assigned to
loki-gateway.grafana-loki.n2x.localendpoint, we must be used it as client URL in Promtail configuration later.
Step 3: Installing Promtail binary in server01
The operating system of our server01 is Ubuntu 22.04 and we don't have any package available in the official Ubuntu repositories, so we are going a download the binary and configure the service.
We can get the Promtail binary from Grafana Releases and install it with the following commands:
cd /tmp
curl -O -L "https://github.com/grafana/loki/releases/download/v3.0.1/promtail-linux-amd64.zip"
# extract the binary
unzip "promtail-linux-amd64.zip"
# move to binray folder
mv promtail-linux-amd64 /usr/local/bin/promtail
# make sure it is executable
chmod a+x /usr/local/bin/promtail
Now we will create the configuration file /etc/promtail-config.yaml with this information:
server:
  http_listen_port: 9080
  grpc_listen_port: 0

positions:
  filename: /tmp/positions.yaml

clients:
  - url: 'http://{N2X_LOKI_GATEWAY_IP}/loki/api/v1/push'

scrape_configs:
  - job_name: system
    static_configs:
      - targets:
          - localhost
        labels:
          job: varlogs
          __path__: /var/log/*log
Warning
Replace {N2X_LOKI_GATEWAY_IP} with the IP address assigned to loki-gateway.grafana-loki.n2x.local endpoint. (10.254.1.14 in this example)
We need to configure Promtail as a service so that we can keep it running in the background:
-
Create a user specifically for the Promtail service:
2. Create a service fileuseradd --system promtail usermod -a -G adm promtail/etc/systemd/system/promtail.servicewith this information:3. Now start and check the service is running:[Unit] Description=Promtail service After=network.target [Service] Type=simple User=promtail ExecStart=/usr/local/bin/promtail -config.file /etc/promtail-config.yaml Restart=always [Install] WantedBy=multi-user.target4. Finally, we enable the Promtail service to start automatically after a reboot:systemctl start promtail.service systemctl status promtail.servicesystemctl enable promtail.service
We can verify that promtail is running properly and exposing metrics with the following command:
curl http://localhost:9080/metrics
Step 4: Connecting server01 to our n2x.io network topology
Now we need to connect server01 to our n2x.io network topology to allow the Promtail agent to push logs to loki-gateway.
Adding a new connected node in a subnet with n2x.io is very easy. Here's how:
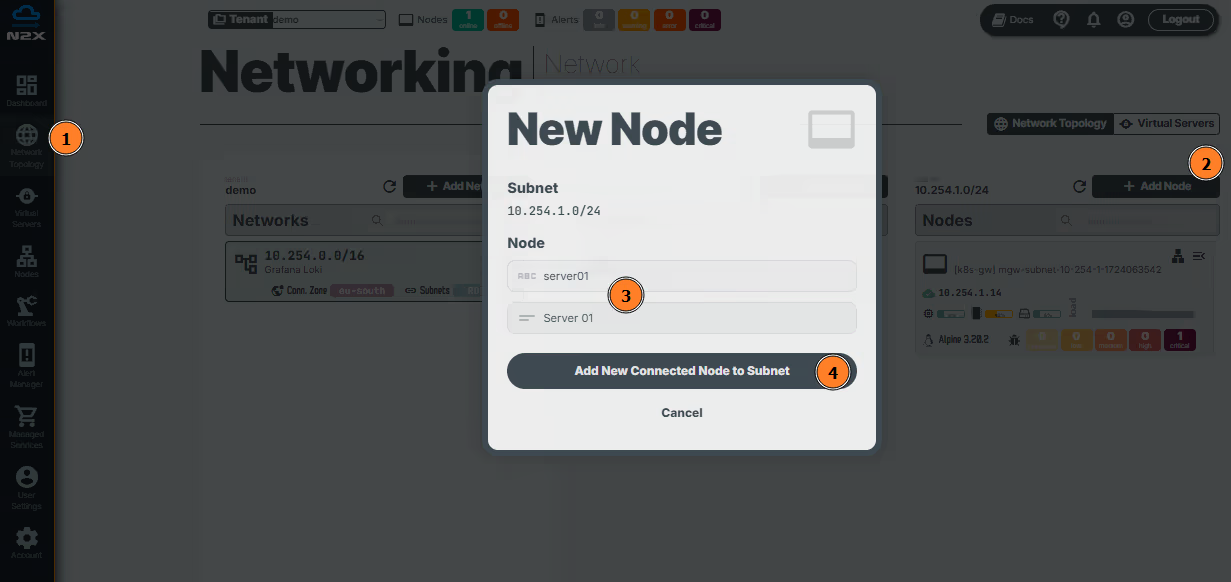
- Head over to the n2x.io WebUI and navigate to the
Network Topologysection in the left panel. - Click the
Add Nodebutton and ensure the new node is placed in the same subnet as theloki-gateway. - Assign a
nameanddescriptionfor the new node. - Click
Add New Connected Node to Subnet.
Here, we can select the environment where we are going to install the n2x-node agent. In this case, we are going to use Linux:
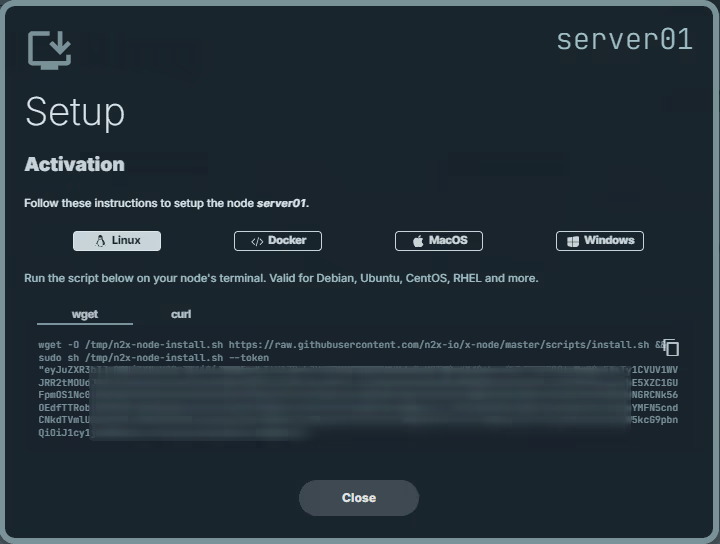
Run the script on server01 terminal and check if the service is running with the command:
systemctl status n2x-node
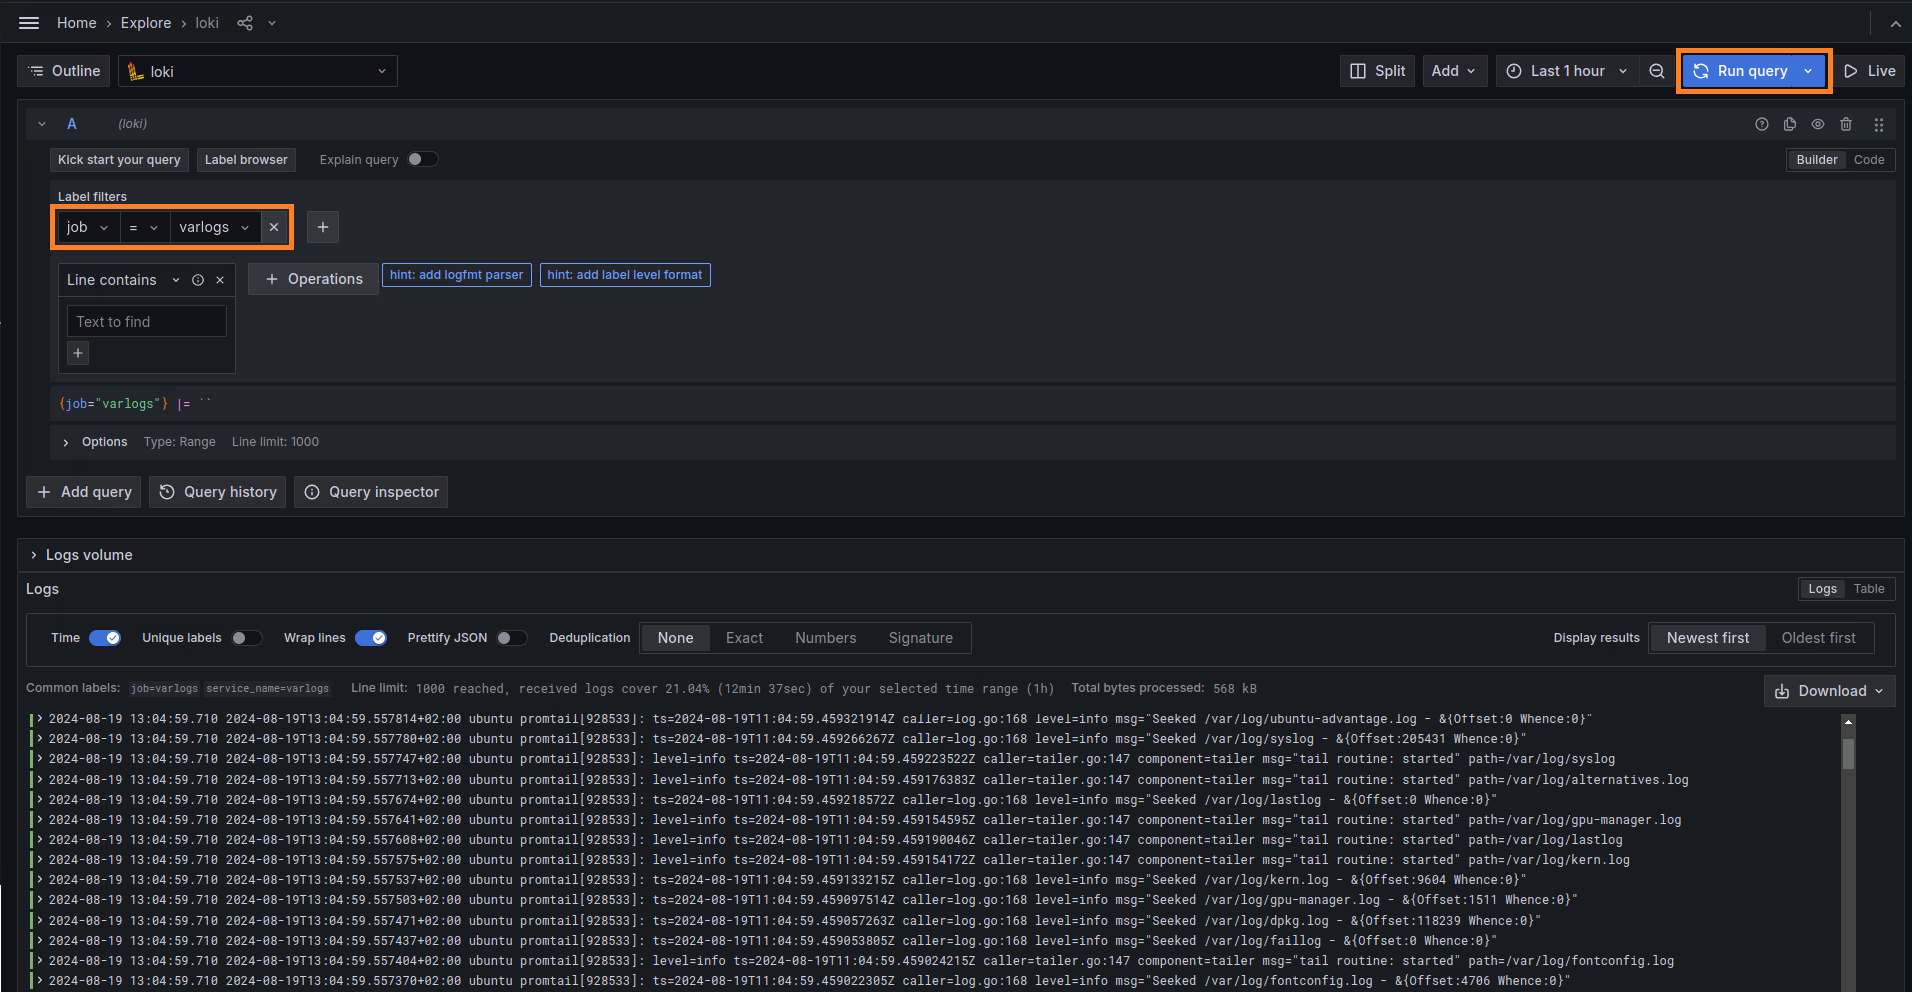
After this, we can check if the data are in successfully stored in Grafana Loki. From Grafana Dashboard click on Explore, select the job = varlogs query and select Run query:
Step 5: Installing Promtail in Kubernetes public cluster worker node
Setting your context to Kubernetes Public cluster:
kubectl config use-context k8s-public
We'll deploy a Promtail DaemonSet to collect logs from our Kubernetes public cluster:
-
We are going to use the official documentation to create a
promtail-k8s-public-ds.yaml.Warning
Replace
{YOUR_LOKI_ENDPOINTwith the IP address assigned to theloki-gateway.grafana-loki.n2x.localendpoint (e.g.,10.254.1.14) and change the protocol from HTTPS to HTTP. -
After that, we can apply the changes with this command:
3. And the Promtail pods should be up and running:kubectl apply -f promtail-k8s-public-ds.yamlkubectl get podNAME READY STATUS RESTARTS AGE promtail-daemonset-cln55 1/1 Running 0 27s
Step 6: Connecting Promtail daemonset to our n2x.io network topology
Just like we did previously with the server01, we need to connect the Promtail to our n2x.io network topology to allow push logs to loki-gateway.
To connect a new kubernetes workloads to the n2x.io subnet, you can execute the following command:
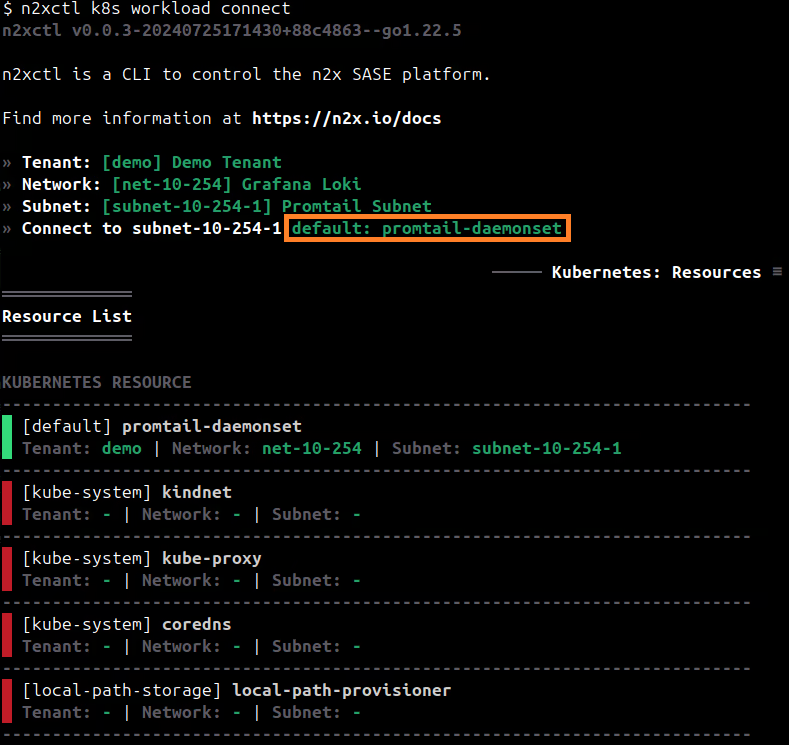
n2xctl k8s workload connect
The command will typically prompt you to select the Tenant, Network, and Subnet from your available n2x.io topology options. Then, you can choose the workloads you want to connect by selecting it with the space key and pressing enter. In this case, we will select default: promtail-daemonset.
We can check the Promtail daemonset workload again:
kubectl get pod
NAME                       READY   STATUS    RESTARTS   AGE
promtail-daemonset-cln55   2/2     Running   0          21s
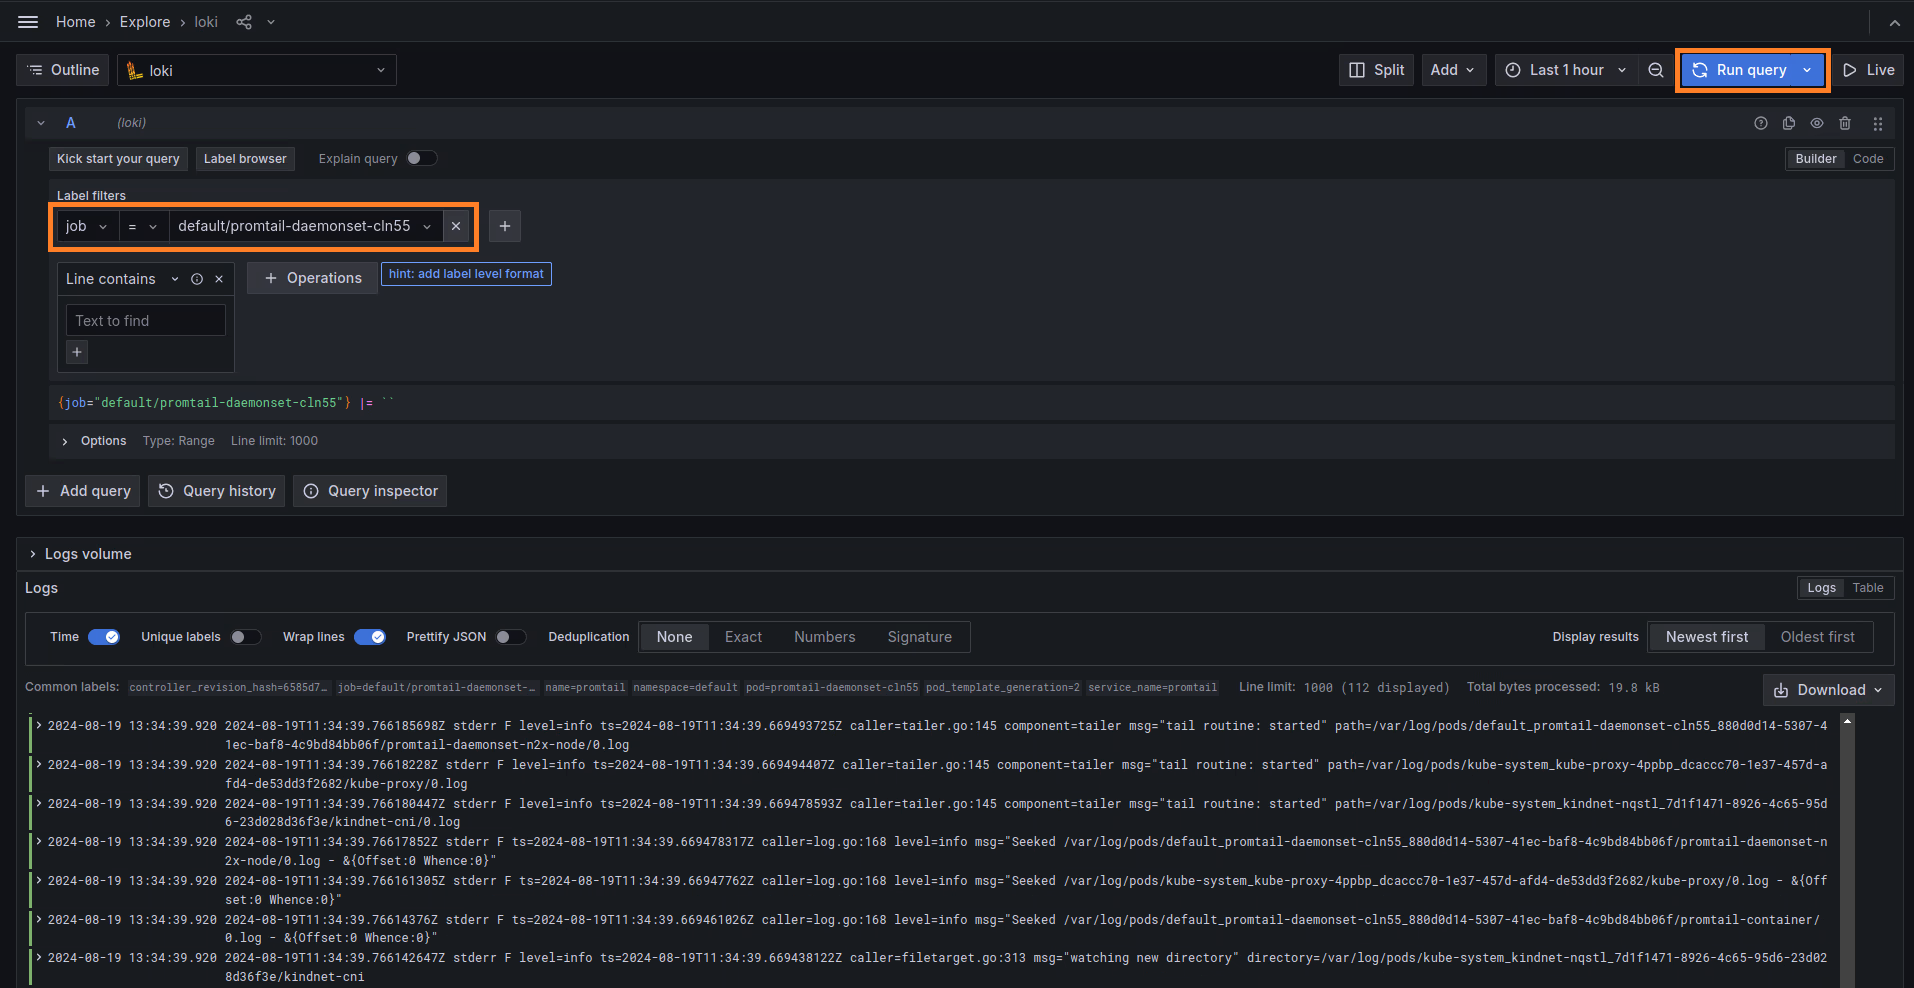
After this, we can check if the data are in successfully stored in Grafana Loki. From Grafana Dashboard click in Explore, select the job = default/promtail-daemonset-cln55 query and select Run query:
Conclusion
In this guide, we've learned how n2x.io can help us create a unified logging solution with Grafana Loki. This unified solution can help the operation teams of your organization to debug and troubleshoot faster in multi-cloud or multi-site environments. In summary, this centralized logging solution eliminates the challenges caused by data silos.
We recommend you read the article Observability Tools as Data Silos of Troubleshooting if this topic was interesting to you.